


The third quarter began with investors debating whether growth was slowing enough to relieve inflation and interest-rate pressure without ending the expansion. It ended with a harder question: whether growth had remained too strong for financial conditions to ease. U.S. activity proved resilient, labor-market stress remained limited, and business investment strengthened. Higher energy prices and renewed Federal Reserve tightening nevertheless drove Treasury yields sharply higher.
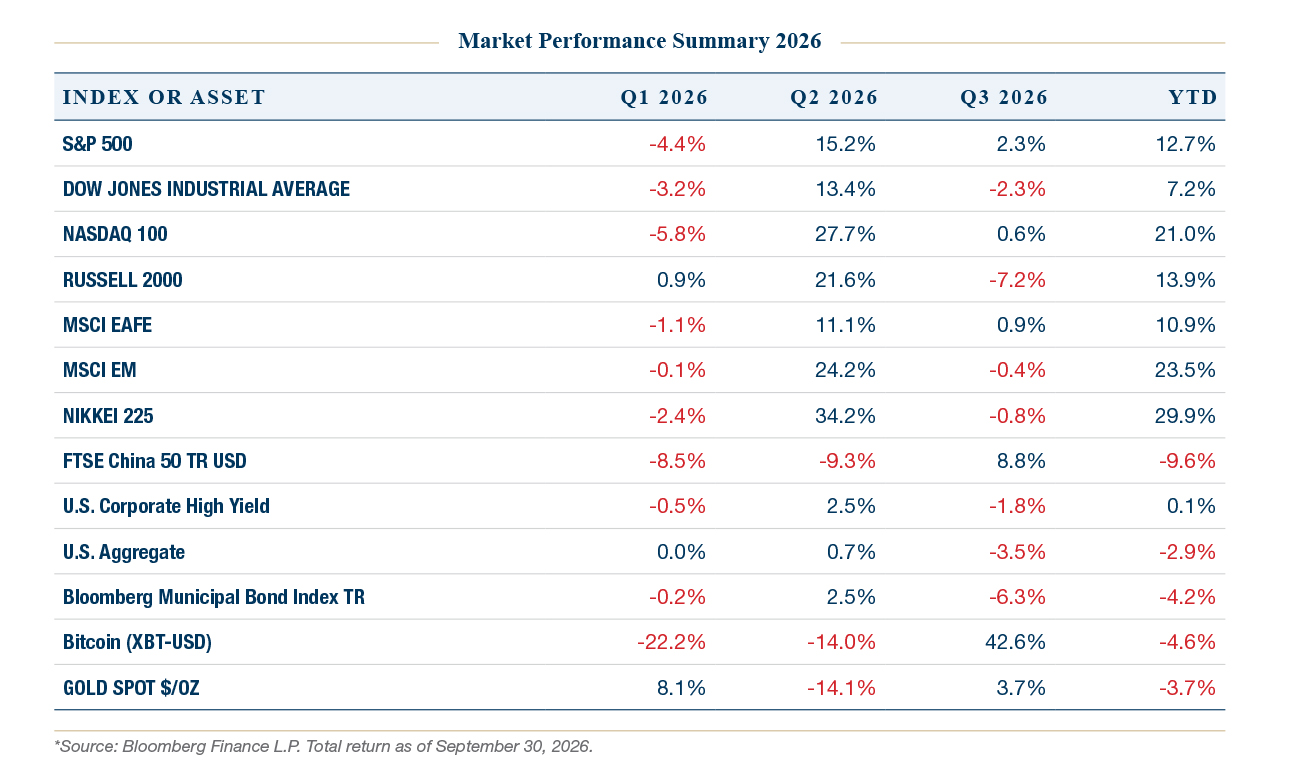
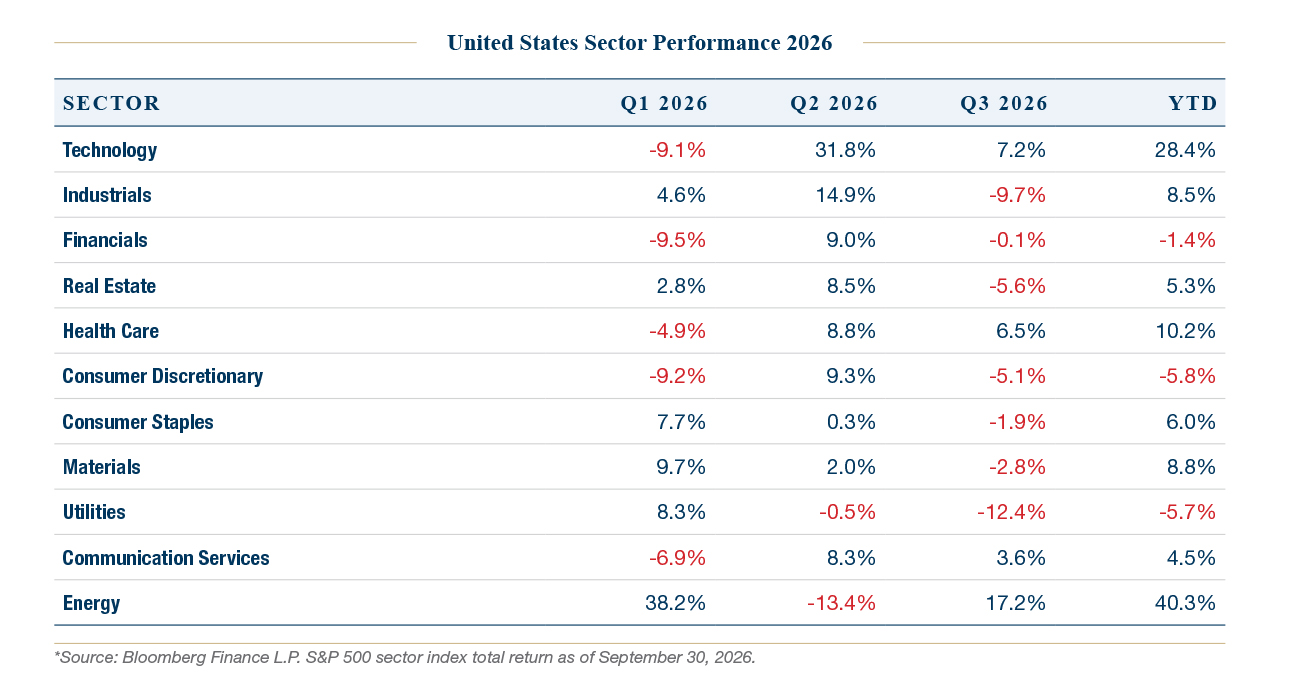
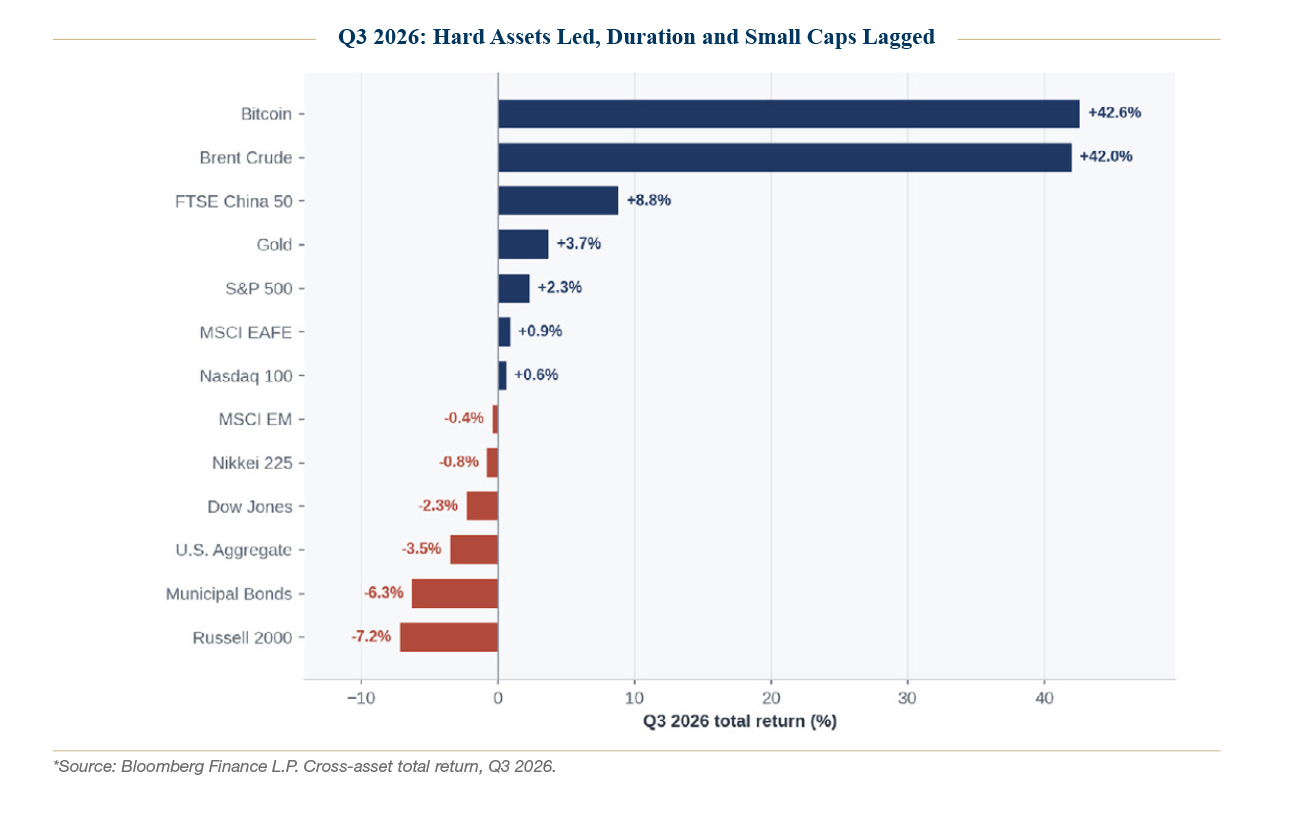
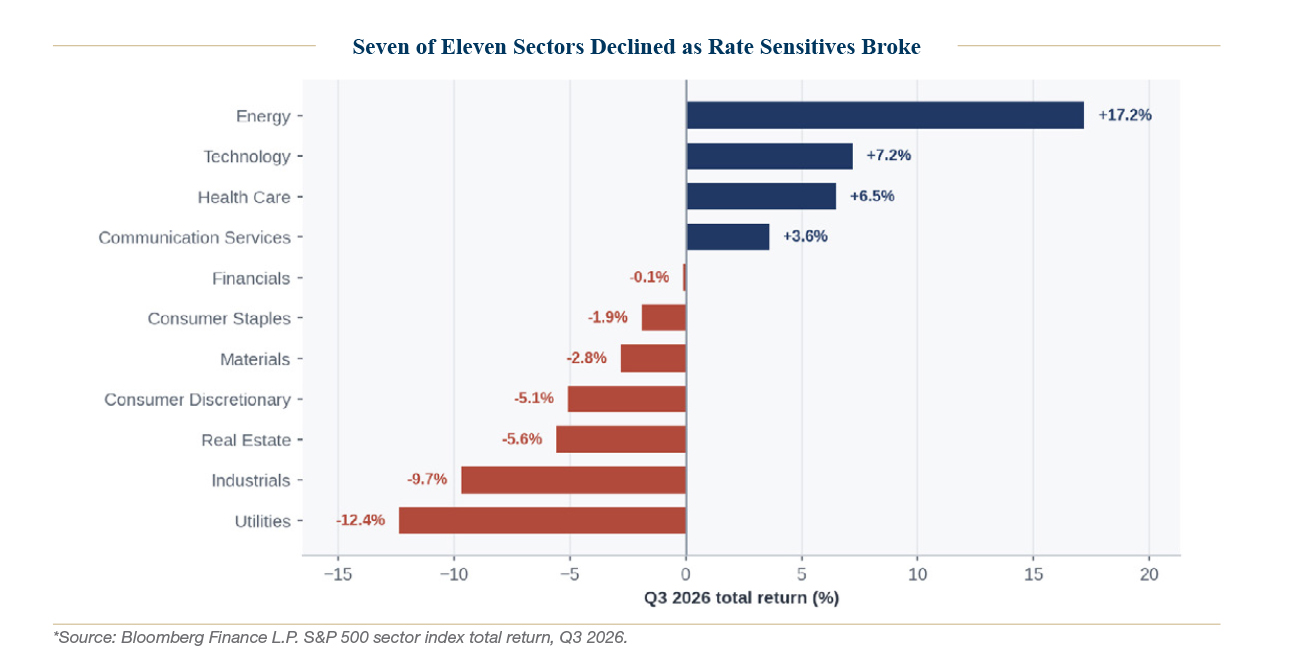
The headline equity returns concealed strain beneath the surface. The S&P 500 gained 2.3% in Q3, but the Dow declined 2.3%, and the Russell 2000 fell 7.2%, while seven of eleven sectors posted losses. Fixed income adjusted more sharply: the U.S. Aggregate fell 3.5%, municipal bonds declined 6.3%, and the 10-year Treasury yield ended the quarter at 5.29%. Credit spreads and equity volatility remained contained, making Q3 less a broad risk-off episode than a forceful repricing of the cost of capital.
We see asset prices as more exposed to uncertainty and volatility around discount rates entering the fourth quarter.
Q3 2026 Market Snapshot
Leadership narrowed after the broad Q2 rebound.
Technology gained 7.2% and Energy 17.2%, while Industrials fell 9.7%, Utilities 12.4%, and Real Estate 5.6%. Small caps and rate-sensitive sectors struggled as yields rose. The sector chart shows how a positive S&P 500 return concealed weakness across most of the market.
International returns were mixed. EAFE rose 0.9%, while emerging markets slipped 0.4%. China rebounded 8.8% in Q3 but remained down 9.6% year to date. Japan gave back 0.8% after its strong Q2 advance.
Oil and Bitcoin each rose more than 40% during the quarter, while gold gained 3.7%. In fixed income, the contrast between large bond losses and modest spread widening points to rising interest rates, rather than credit deterioration, as the dominant source of stress.
The Macro Backdrop from Stabilization to Constraint
Third-quarter data largely confirmed the durability of the expansion and stabilization we described in our second-quarter review, but it also exposed its cost. Growth accelerated late in the quarter, energy prices rose, and the Federal Reserve shifted from resisting cuts to raising rates. Markets could no longer assume that economic resilience would be rewarded with easier financial conditions.
United States Growth Resilient in Aggregate
The expansion entered Q3 on firmer footing than previously estimated. Second-quarter real GDP growth was revised to a 2.2% annualized rate from 1.5%, with investment, consumer spending, and government spending all revised higher. Subsequent data pointed to continued strength in consumption and business activity, although income growth and regional indicators remained uneven.
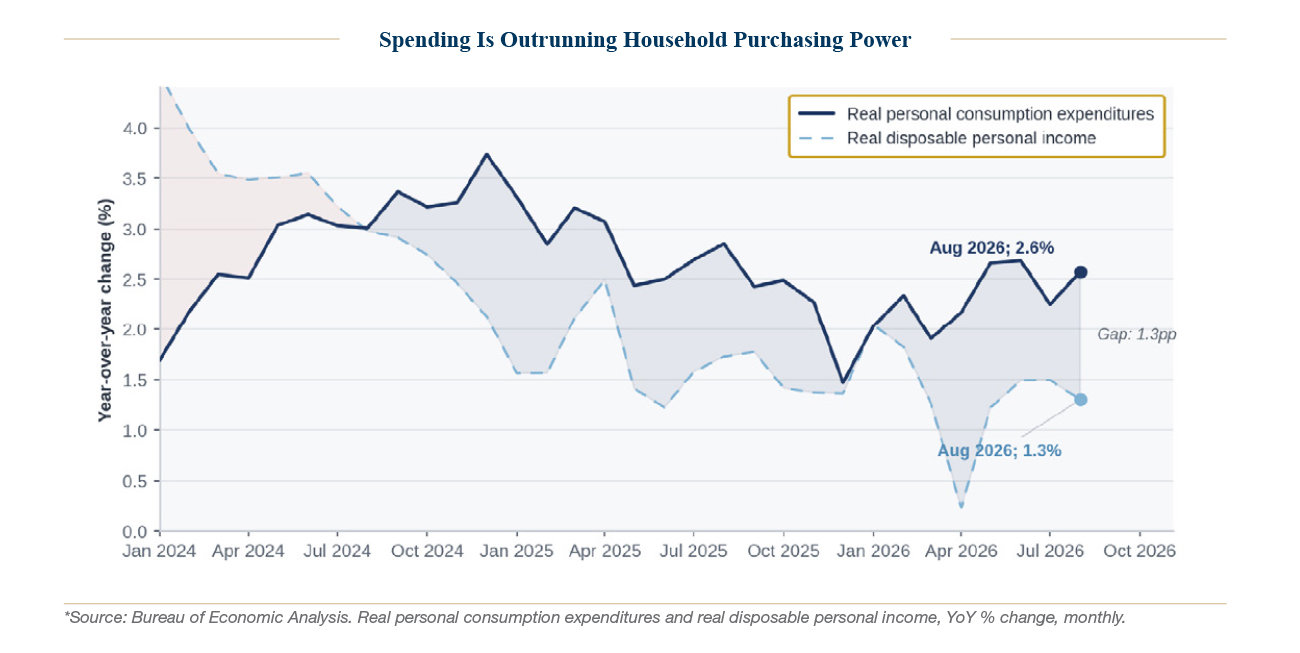
Consumption remained strong. August personal spending rose 0.9% in nominal terms and 0.6% after inflation, the largest real monthly increase in seventeen months. Goods led the advance. Personal income grew only 0.2%, and real disposable income was flat, however, leaving spending growth ahead of household purchasing power.
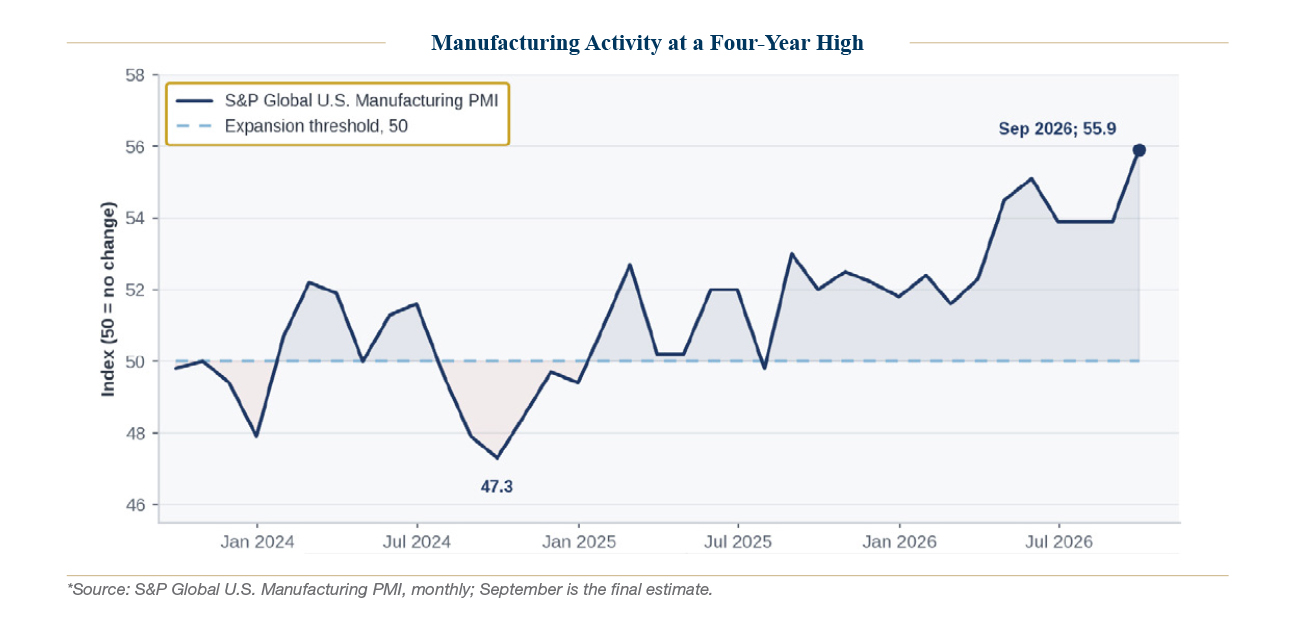
Business activity accelerated. The final September S&P Global U.S. Manufacturing PMI rose to 55.9 from 53.9, its strongest reading since May 2022. Output and new orders strengthened, although export orders continued to contract amid tariffs and elevated shipping costs. Nondefense capital-goods orders excluding aircraft gained 1.6% in August, reinforcing the evidence of firm investment demand.
The breadth of that strength remained uneven. The August goods trade deficit widened to $132.6 billion as imports rose 5.5%, partly reflecting investment and inventory build, but potentially subtracting from measured GDP. Regional manufacturing surveys also diverged: Richmond remained in contraction while Kansas City and Dallas were positive. Aggregate growth continued to coexist with pressure on households and smaller businesses.
Labor, Consumption, and Housing
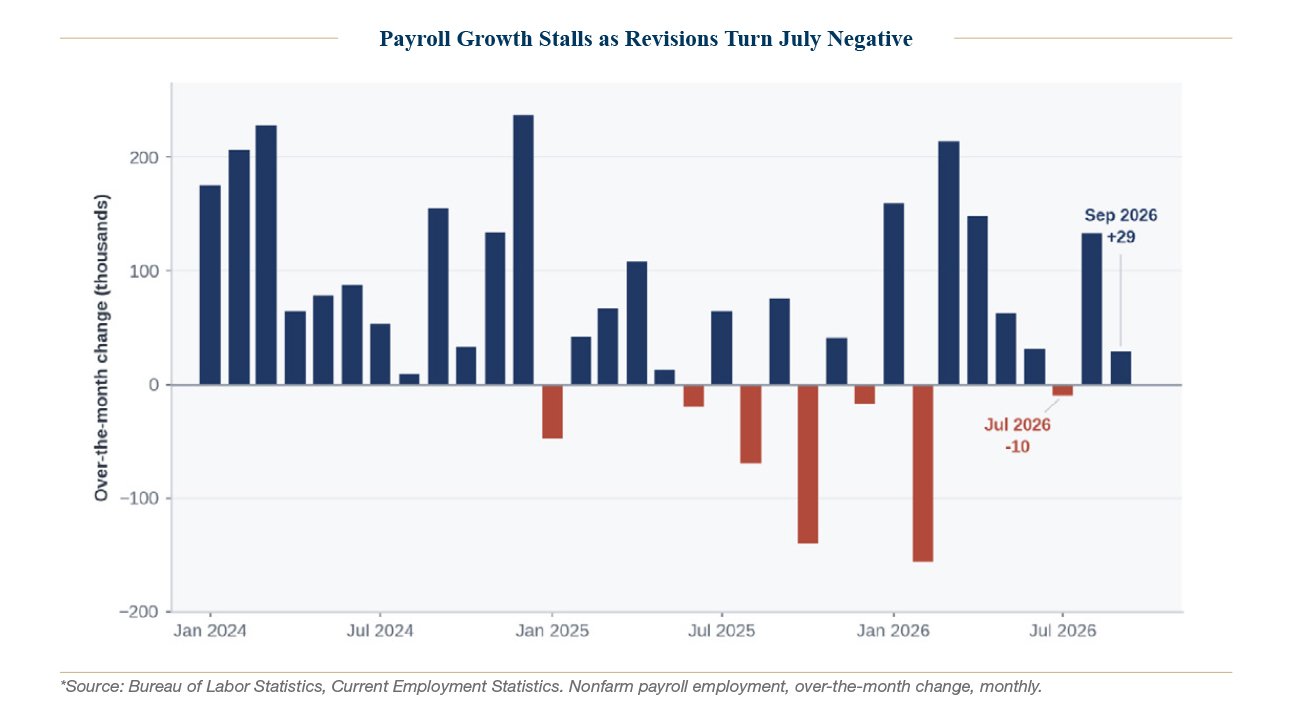
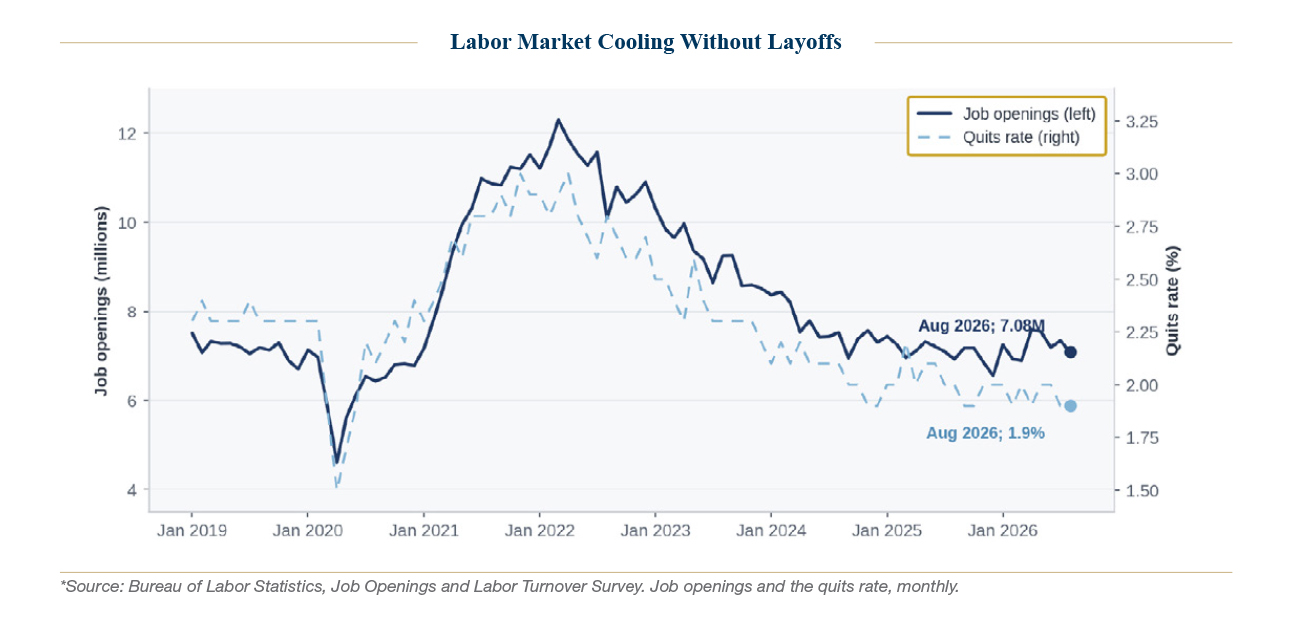
The labor market cooled through weaker hiring rather than widespread layoffs. September payrolls rose just 29,000, below the 45,000 monthly average of the prior year. Revisions cut July and August by a combined 60,000, turning July negative. Unemployment remained at 4.2%, and initial claims stayed low, but the private-sector diffusion index fell below 50, and job openings declined to 7.079 million. Employers were holding on to workers while creating few new jobs.
That labor-market balance supported spending, but household finances were less comfortable. September hourly earnings rose 3.0% from a year earlier, only modestly ahead of inflation, while consumer sentiment fell to 48.1. One-year inflation expectations remained at 4.6%. Higher asset prices helped some households, but renters, new homebuyers, and borrowers faced a different reality as rates climbed.
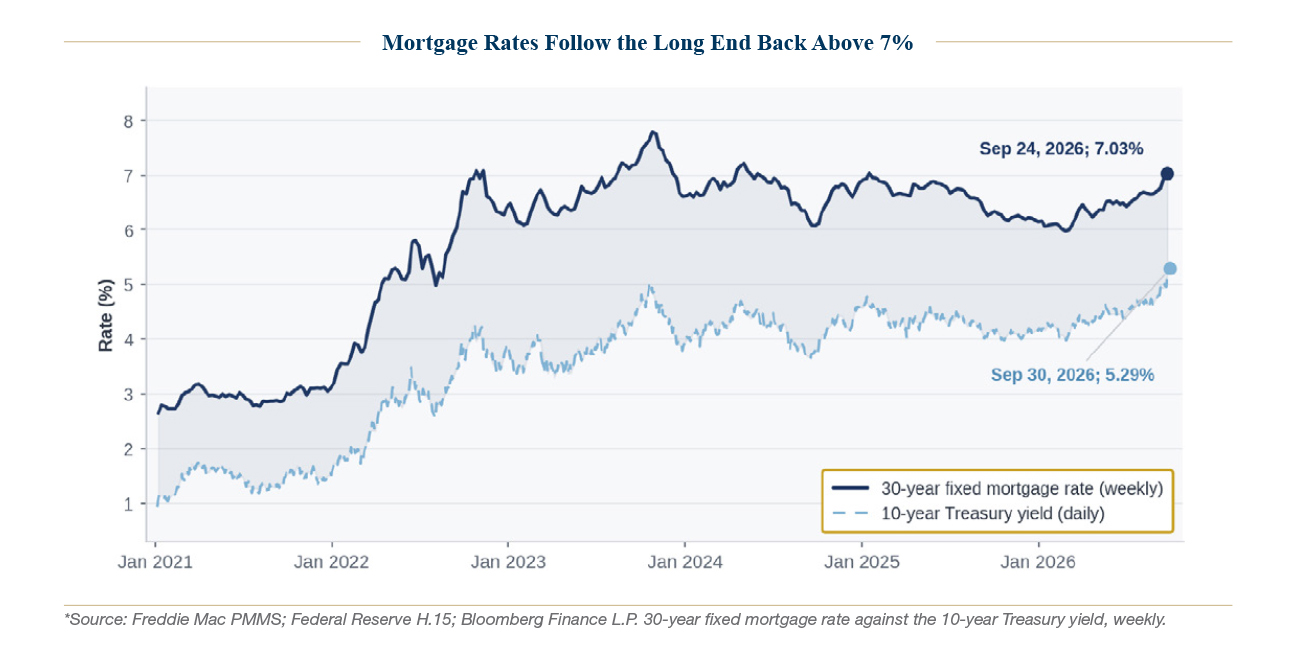
Housing remained the clearest channel through which higher Treasury yields constrained demand. The average 30-year mortgage rate climbed to over 7% in the final full week of September, and applications fell 6.0%, their fourth consecutive weekly decline. Home prices held up better than transactions: the Case-Shiller 20-City index rose 2.5% year over year in July, although real home prices declined for a fourteenth consecutive month. Limited affordability and homeowners’ reluctance to replace low-rate mortgages continued to restrict turnover.
Inflation, Energy, and the Strait of Hormuz
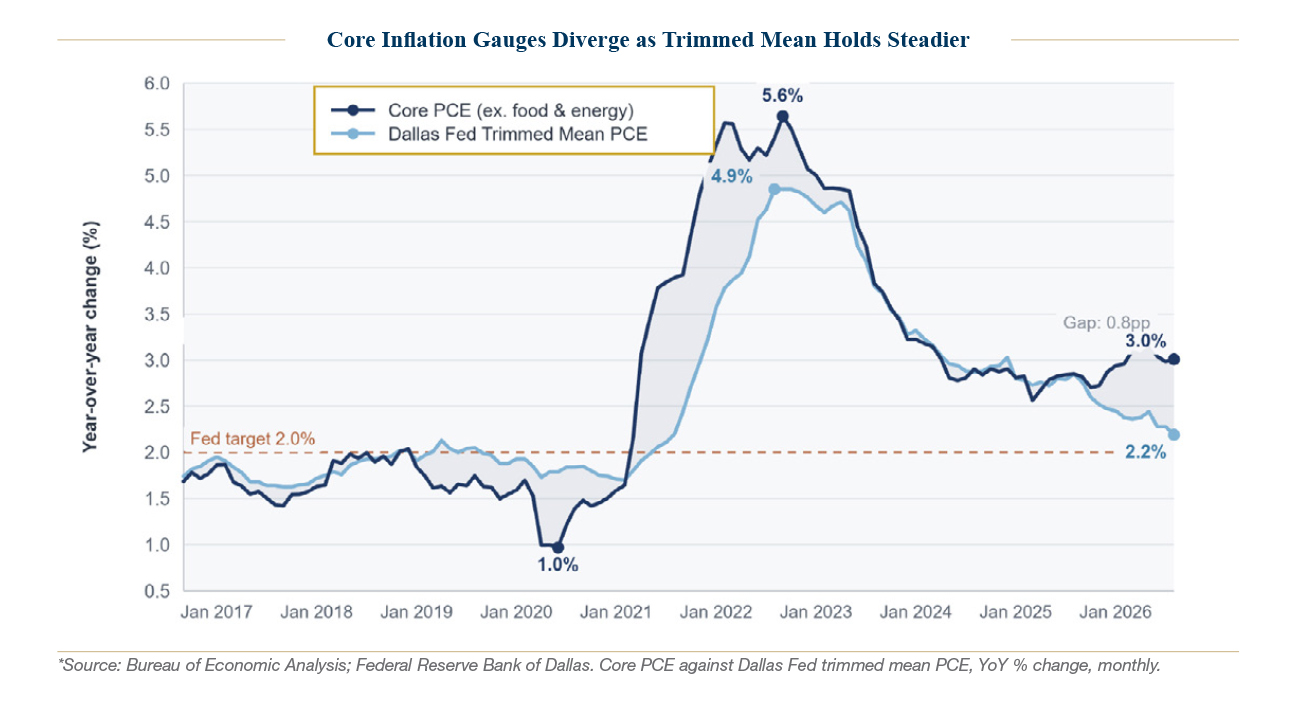
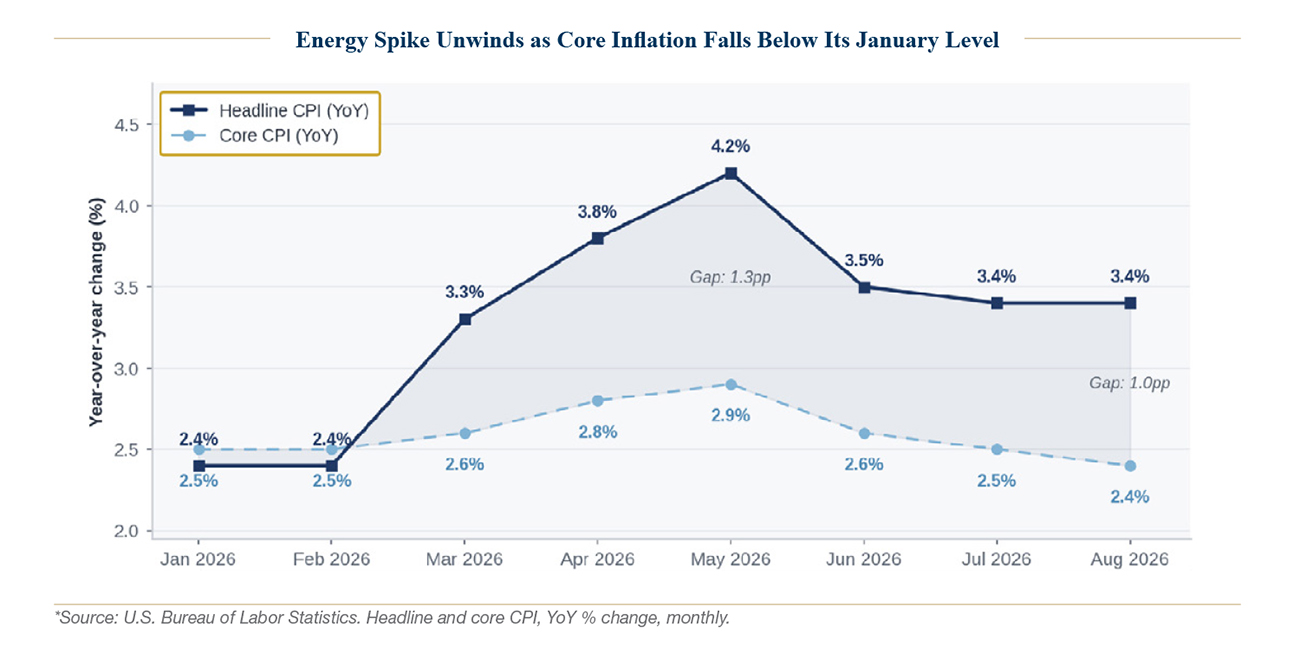
Underlying inflation improved during the quarter but remained above the Fed’s objective. August core PCE rose 0.2% for the month and slowed to 3.0% year over year from 3.4% in May. Headline PCE held at 3.4%, while headline CPI eased to 3.4% from 4.2% in May. The Dallas Fed trimmed mean remained at 2.2%, suggesting less persistent pressure than the broader core measure.
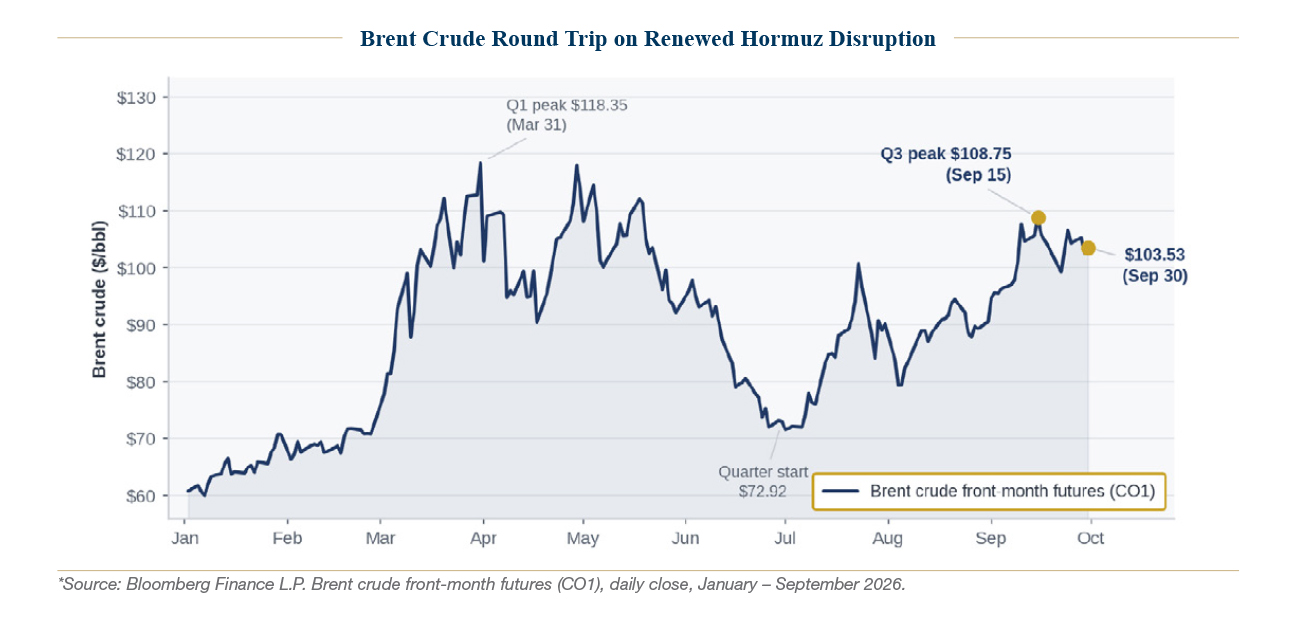
Energy posed a renewed threat. Brent crude rose 42.0% during Q3 to $103.53, after peaking at $108.75 on September 15, the day before the Federal Reserve raised rates. Alternative export routes and diplomatic progress eased the disruption, but the Wall Street Journal reported emergency Hormuz shipping costs of $15 to $20 per barrel before insurance. S&P Global, citing Marsh, reported war-risk premiums of 7.5% to 10% of vessel value, equivalent to roughly another $4 to $5 per barrel for a $100 million tanker carrying two million barrels. These costs sustained oil’s conflict premium, threatening consumption while raising inflation expectations and business costs. September manufacturing surveys also showed rising input costs and longer delivery times, creating tension with the improvement in measured consumer inflation. Monetary policy cannot resolve a supply disruption, but the Fed must respond if it begins to influence wages, expectations, and broader pricing behavior. Household inflation expectations and regional selling-price surveys left that second-order risk material.
For Q4, oil is the most direct link between geopolitics, inflation, and growth. A further rise would squeeze real incomes and could keep the Fed tightening. Normal shipping and a durable diplomatic agreement would ease that pressure, though neither outcome is assured.
The Federal Reserve and the Treasury Selloff
On September 16, the Federal Reserve raised its policy rate by 25 basis points to a range of 3.75% to 4.00%, its first increase since 2023. The unanimous decision and projections left room for another increase this year. With measured inflation moderating, the move appeared to reflect concern that stronger growth and renewed energy pressure could prevent inflation from converging toward target.
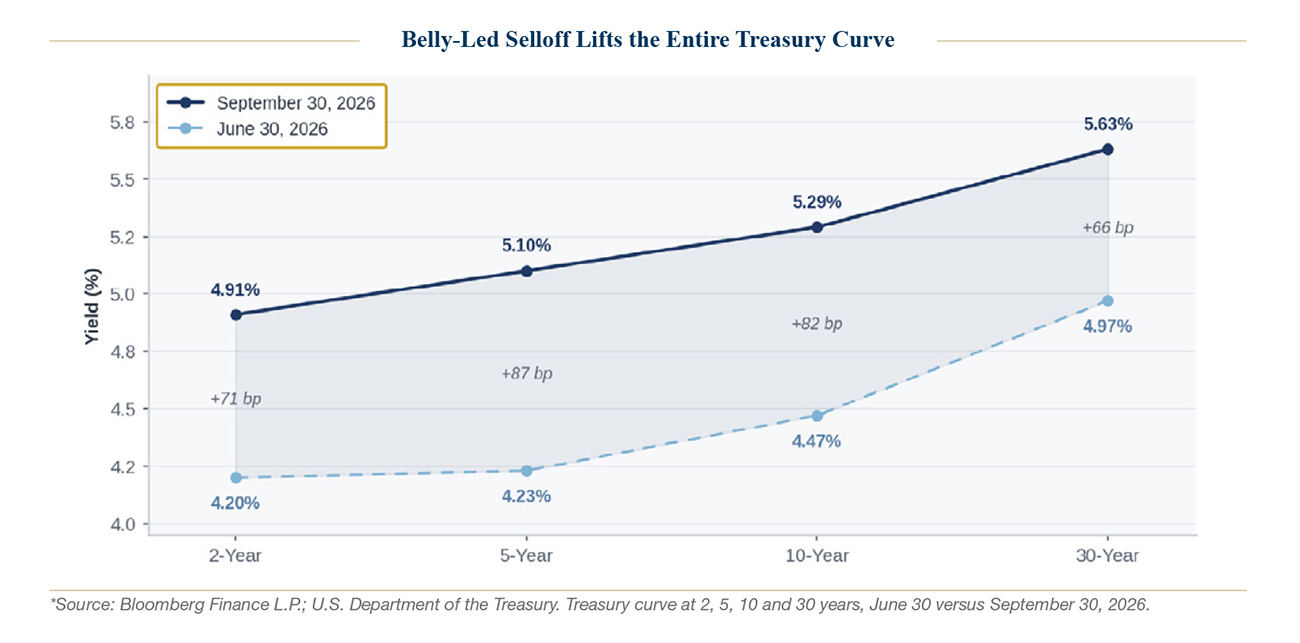
Treasury yields had already been repricing before the decision. The 10-year rose 82 basis points during Q3 to 5.29%, while the five-year increased 87 basis points, the largest move among the major maturities. July and August were dominated by long-end pressure consistent with term premium, supply, and fiscal concerns; September brought a sharper front-end adjustment to the expected policy path. The two-year ended at 4.91% and the 30-year at 5.63%.
The sequence points to both policy expectations and the compensation investors require to hold longer-term debt. Together, these forces raised financing costs for mortgages, businesses, and real estate, while increasing the discount rates applied to equities and private assets.
Real financing costs also bear watching relative to growth. Subtracting the five-year breakeven inflation rate of 2.33% from the 10-year nominal yield of 5.29% gives a rough inflation-adjusted proxy of 2.96%, above recent quarterly real GDP growth of 2.2% to 2.5% at annualized rates. This comparison uses different maturities and horizons; it is neither a directly observed 10-year real yield nor a precise debt-sustainability threshold. It nevertheless illustrates the pressure elevated financing costs can place on debt service, margins, and refinancing capacity if growth slows.
The Fed must balance firm activity and limited layoffs against stalled payroll growth, weaker job openings, and weaker consumer confidence and housing. The September employment report arrived after the rate decision and complicates its justification. The question is whether late-quarter strength can persist as the cumulative effect of higher rates spreads through the economy.
Fixed Income Higher Yields and Concentrated Stress
The bond selloff reset starting yields higher, improving prospective income for new buyers, especially in high-quality and tax-exempt bonds. Municipal bonds fell 6.3%, leaving longer maturities more attractive relative to Treasuries. For taxable investors, that income may be compelling when maturity, credit quality, and liquidity fit the portfolio. Higher starting yields offer a larger cushion, but the case for duration remains conditional. Bonds could benefit if growth weakens and inflation moderates; another energy shock or further Fed tightening could push yields higher first. Our view is that the income opportunity warrants selective exposure rather than an oversized duration position.
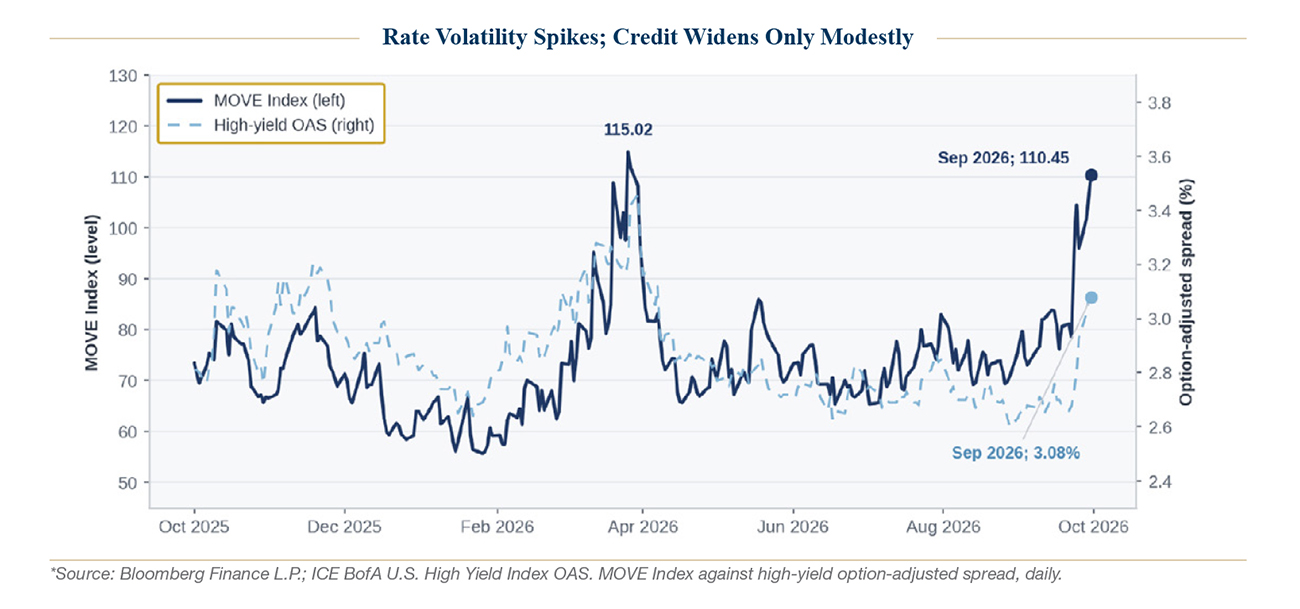
Market stress remained concentrated in rates. The MOVE Index rose from 71.96 at mid-year to 110.45, with nearly all the increase in the final seven sessions. High-yield option-adjusted spreads widened from 2.75% to 3.08% but remained historically tight, while the VIX stayed near 15. Investors priced substantial rate uncertainty without a comparable increase in default concerns or equity volatility.
That divergence remains vulnerable to persistent high yields. Rate volatility and credit spreads had worsened late in the quarter, and pressure could spread into housing, credit, capital spending, and valuations. Strong nominal growth and earnings expectations continued to provide support, but tight spreads offered limited protection against a weaker outcome.
Equities, Artificial Intelligence, and Productivity
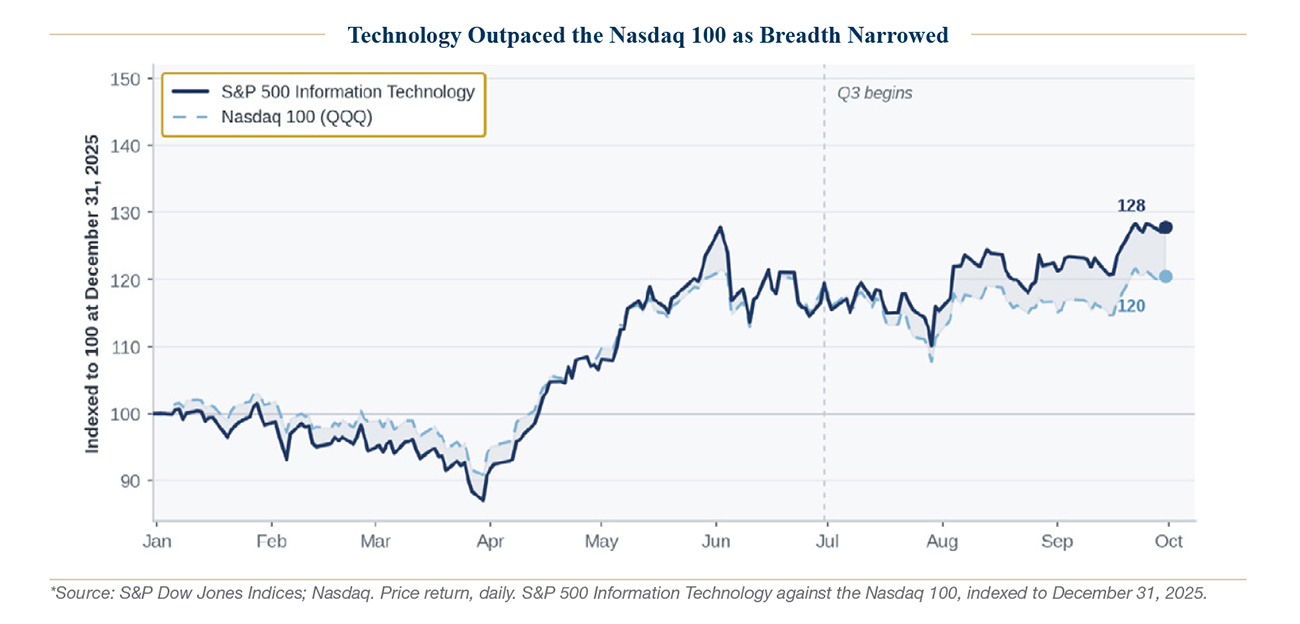
Equity investors continued to reward AI infrastructure demand but became more selective about valuation and cash-flow timing. Technology advanced 7.2%, but the Nasdaq 100 added only 0.6% after its 27.7% second-quarter surge. The gap reflects composition: the Nasdaq 100’s large non-technology holdings in consumer discretionary and staples detracted, with those sectors down 5.1% and 1.9% respectively. Earnings resilience faced a higher discount-rate hurdle.
Spending on data centers, computing, networking, and power continued to support demand for technology suppliers. The next test is whether that investment produces durable revenue, margins, and returns on capital. Higher financing costs make the quality of those returns more important.
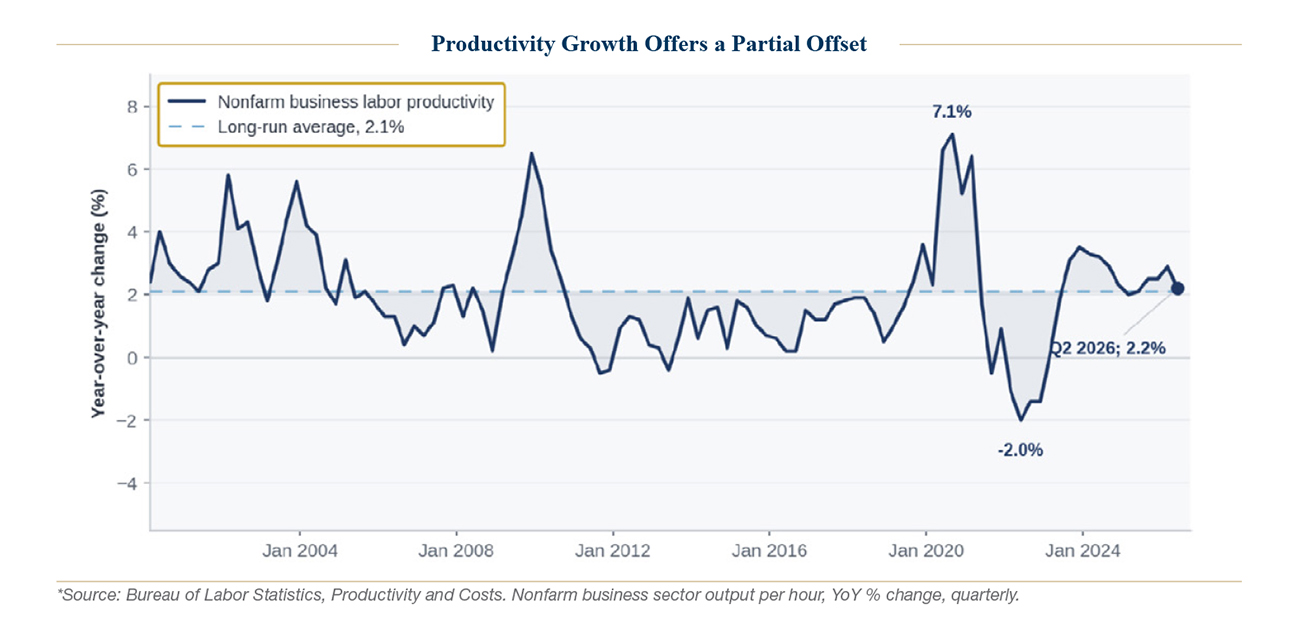
Productivity could help reconcile solid growth with lower inflation. Nonfarm business productivity rose 2.2% year over year in Q2, but that single reading does not establish an AI-driven productivity boom. Faster productivity would let output grow with less pressure on prices; for now, it is a possibility rather than an assumption.
Weak small-cap and rate-sensitive returns reinforce for us the importance of balance-sheet strength. Companies reliant on floating-rate borrowing or near-term refinancing have less room to absorb higher rates than firms with durable cash flow and modest debt.
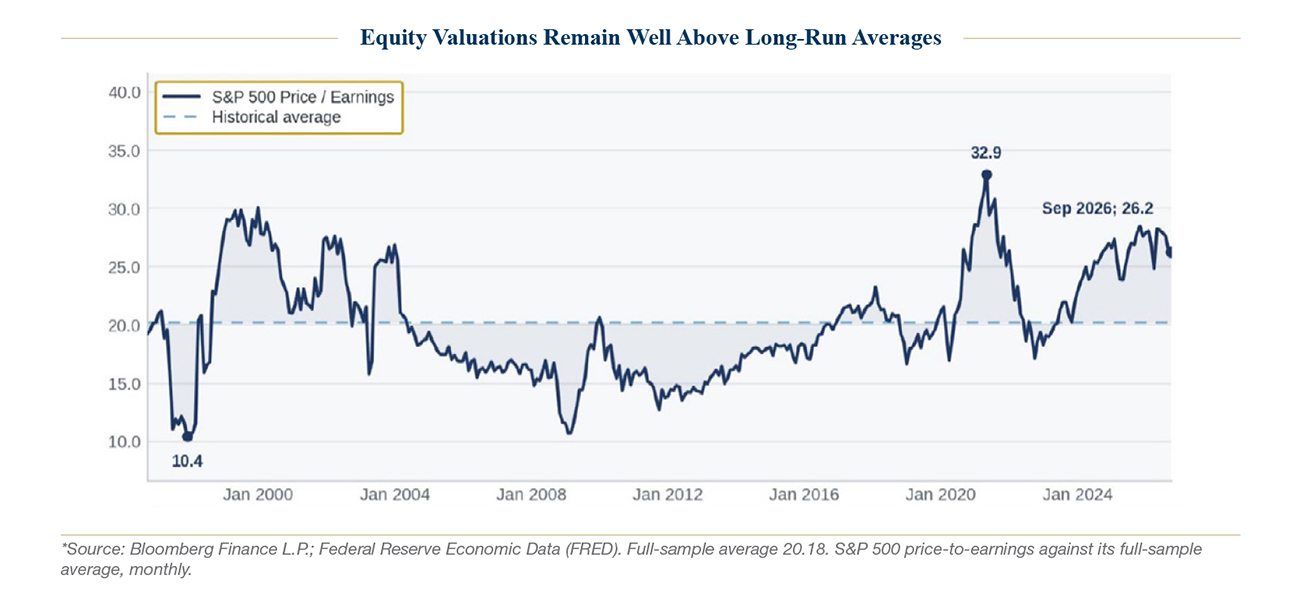
The S&P 500 ended September at 26.2 times trailing earnings, about 30% above its 20.18 average since 1996. The multiple remains below its 2021 peak of 32.9, but higher Treasury yields make today’s premium more consequential.
Valuations eased in Q3 because earnings grew faster than share prices. The S&P 500 rose about 2% while its trailing P/E fell from roughly 27.6 to 26.2, implying about 7% trailing earnings growth. Since year-end, the index has gained 12% while its P/E fell from 30.8, implying earnings growth near 31%. Earnings have helped justify prices, but the market still depends on that growth continuing.
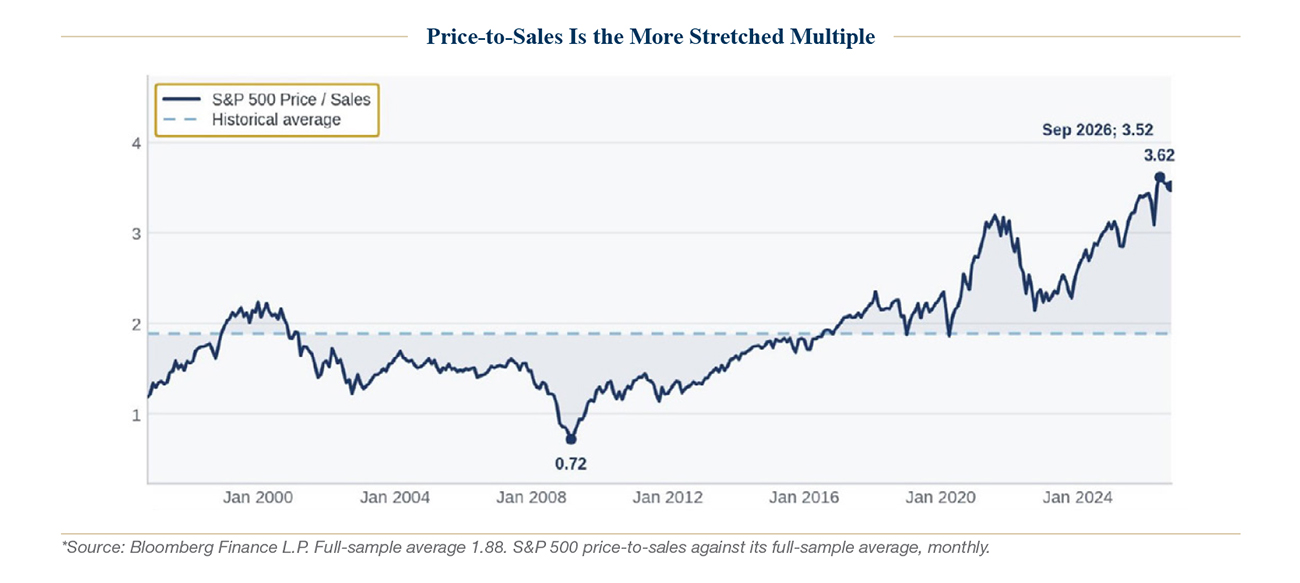
Price-to-sales tells a more demanding story. At 3.52 against a full-sample average of 1.88, the index trades at nearly double its historical revenue multiple, and it has not closed a month below that average since 2016. The gap between the two measures is itself informative: a price-to-earnings multiple 30% above average alongside a price-to-sales multiple 87% above average implies that today’s profit margins are doing a great deal of work. The valuation case therefore rests not only on earnings growth but on margins holding at historically high levels.
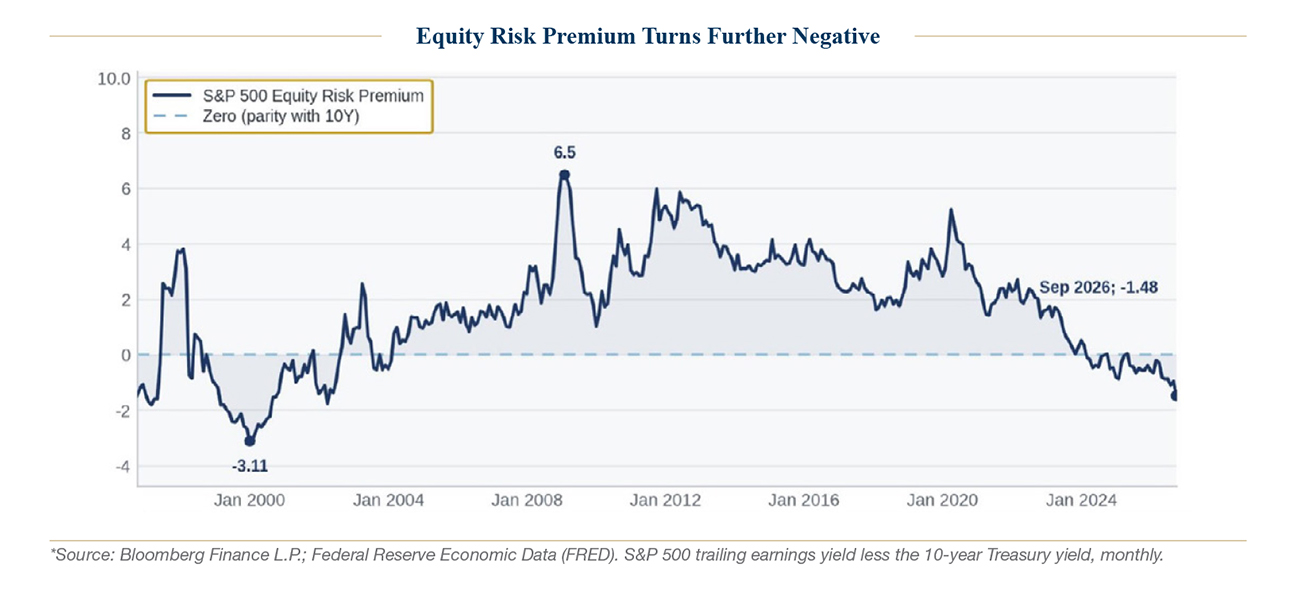
It is also worth mentioning the equity risk premium. Measured as the trailing earnings yield minus the 10-year Treasury yield, it ended September at -1.48%, down from -0.40% at the end of March as the 10-year rose sharply during the quarter. On this trailing earnings-yield measure, the valuation cushion relative to Treasuries has disappeared. That does not establish that equities will underperform Treasuries, nor is it a reliable timing signal. It does indicate that investors are receiving unusually limited earnings-yield compensation for assuming equity risk, increasing the importance of earnings durability, balance-sheet strength, and valuation discipline.
A negative premium persisted for most of the late 1990s while equities continued to rise, and it can resolve through falling yields as readily as through falling prices. Its value is as a measure of compensation, and that compensation has gone.
Global Conditions Remained Uneven
Conditions outside the United States were uneven. Euro Area activity strengthened as the September Composite PMI reached 53.1, its highest level in roughly three and a half years, though the ECB raised its main refinancing and deposit rates to 2.65% and 2.50% on September 10, its second increase of the year, as higher energy costs lifted inflation forecasts, and rising yields left the STOXX 600 down about 1% in Q3. China equities rebounded 8.8%, with September official manufacturing and nonmanufacturing PMIs moving marginally into expansion at 50.1 and 50.2. Industrial profits rose 15.7% over the first eight months of the year, although monthly growth slowed to 4.2% in August, and broader growth concerns and unresolved U.S.-China trade and technology issues persisted despite a truce extended to January 10. Japan’s Nikkei slipped 0.8% after its strong Q2 advance, as second-quarter GDP grew at a revised 1.4% annualized rate while private consumption was flat, and capital expenditure declined. Wage growth remained firm at 3.8% in August, and the September composite PMI eased to 52.3, still in expansion.1
What stood out globally in Q3 to us was not synchronized growth but synchronized financial tightening. Europe faced stronger activity but renewed inflation pressure from energy prices. China stabilized but remained dependent on policy support and confidence restoration. Japan continued its gradual transition away from years of extraordinary monetary accommodation. Despite very different economic conditions, long-term interest rates moved higher across many major markets. The result was a global increase in the cost of capital, reinforcing pressure on rate-sensitive assets and reducing the valuation support that investors had enjoyed during periods of extraordinarily low yields.
Outlook and Portfolio Implications
Entering Q4, the key question that we see is whether activity can moderate enough to relieve inflation and policy pressure without materially weakening employment, credit, or earnings. Continued acceleration could require more tightening, while a sudden slowdown could expose the cumulative burden of higher financing costs.
Across asset classes, we emphasize quality: durable cash flows, strong balance sheets, pricing power, and demonstrable returns on capital, since higher rates increase the penalty for leverage, distant cash flows, and valuations dependent on flawless execution. In fixed income, the selloff has improved prospective income, particularly in high-quality and tax-exempt bonds, though we would avoid oversized duration exposure while inflation and Fed uncertainty remain elevated, and tight credit spreads argue for selectivity rather than broad risk-taking. More broadly, we believe that strategies that do not depend on falling rates or expanding equity multiples remain valuable, and cash and short-duration assets provide meaningful income while preserving flexibility as policy and geopolitical conditions evolve.
In our view, Q3’s message was not that the expansion had ended. It was that resilience no longer guaranteed easier financial conditions. Growth supported earnings; higher rates raised the hurdle those earnings must clear. That tension is likely to matter more than the headline index return in Q4.
Disclosure
A&M Private Wealth Partners, LLC (“AMPWP”) is an SEC-registered investment adviser. SEC registration does not imply a certain level of skill or training. For additional information on the services AMPWP provides, as well as our fees for such services, please review our Form ADV at adviserinfo.sec.gov, contact us at 300 Banyan Boulevard, 10th Floor, West Palm Beach, FL 33401, or call us at (561) 268-0900.
This piece and its content reflect AMPWP’s views at the time of its writing, and the information presented and AMPWP’s views are for informational purposes only. Such views are subject to change at any time without notice including due to changes in market or economic conditions, and forward-looking statements or forecasts are based on assumptions and may not be realized. Future events and outcomes are inherently uncertain. Statements are subject to risks and uncertainties that could cause actual outcomes to differ. AMPWP has obtained information provided herein from various third-party sources believed to be reliable, however, such information is not guaranteed and is subject to errors, omissions, and changes. No reliance should be placed on the views and information presented when making any investment or liquidation decision. AMPWP is not responsible for the consequences of any decisions or actions taken or not taken as a result of the views and information presented, and AMPWP does not warrant or guarantee the accuracy or completeness of this piece or information presented.
Additional content may be relevant for further context or other insight. Portfolios should also be viewed in the context of the broad market and general economic conditions prevailing during the periods covered by performance and other information. Any references to future returns and/or risk are not promises of the actual return a portfolio may achieve nor do they reflect all risks. Not all investments are suitable for all investors. All investments involve risk of loss, including to principal, and all investors must be prepared to bear such loss. Different securities, strategies, and allocations have different costs and risks, and diversification also does not assure a profit nor protect against a loss. Past performance is not a guarantee of future results. Additionally, changes in investment strategies, contributions, or withdrawals may materially alter results, as may market conditions, other factors including but not limited to economic factors, fees, expenses, and events. Nothing herein should be construed as an investment recommendation. AMPWP does not provide legal, accounting, or tax advice, and AMPWP’s services are not intended to act as a substitute for such advice. AMPWP encourages you to seek the counsel of a qualified attorney and/or accountant for legal, accounting, or tax advice.