


- Municipal bonds fell sharply, down 6.35% amid rising yields, record issuance, and weaker demand.
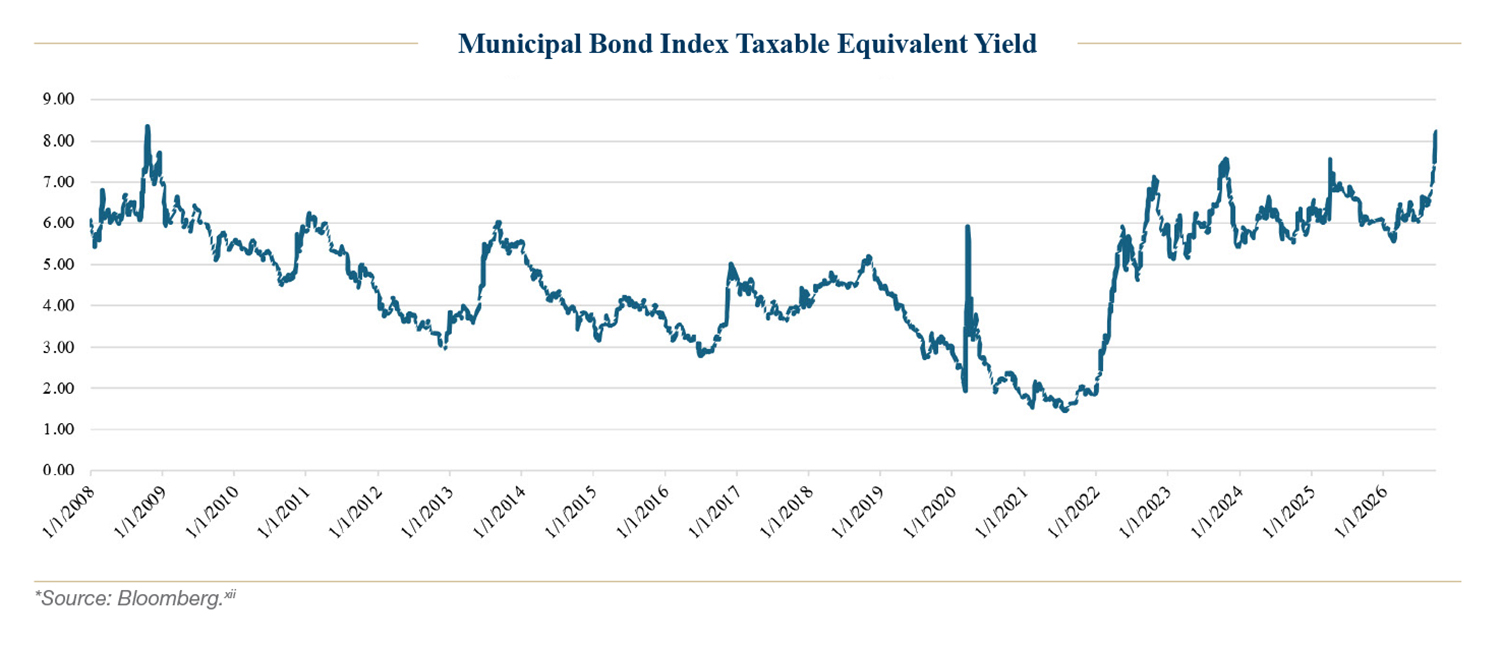
- Higher yields create new opportunities, with taxable-equivalent yields reaching levels not seen since 2008.
- Strong economic growth and persistent inflationhave complicated the interest-rate outlook and prompted further Fed tightening.
- Municipal credit fundamentals remain broadly sound, but rising downgrades signal mounting pressure in certain sectors.
- AMPWP sees selective opportunities ahead, with credit quality, issuer fundamentals, and disciplined security selection increasingly important.
Introduction
The third quarter saw sharp repricing across the municipal bond market. Rising Treasury yields, heavy new issuance, and weaker investor demand pushed municipal yields markedly higher, producing the Bloomberg Municipal Bond Index’s weakest monthly return since September 2008 in the quarter’s final month. Yet, in our view, the forces behind the selloff were not primarily signs of widespread municipal credit deterioration. Instead, the market was contending with an economy that continued to expand, renewed inflation concerns, a Federal Reserve willing to tighten policy, and a supply backdrop that tested investors’ capacity to absorb new bonds.
That distinction matters. The decline in bond prices resulted in near-term negative returns for existing holders, but it also altered the asset class’s prospective economics. By September 30, municipal yields had reached levels not seen in more than a decade, and relative value versus Treasuries had improved considerably. At the same time, the credit picture became less uniform. Rating actions and sector developments suggest that the broad strength of municipal credit remains intact, but the gap between stronger and weaker issuers may widen as governments, schools, hospitals, and utilities confront different combinations of slower revenue growth, rising costs, and policy risk.
Quarterly Returns and Drivers
A significant rise in global bond yields, including in the U.S. municipal bond market, drove sharply negative returns in the 3rd quarter. The Bloomberg Municipal Bond Index returned -6.35% for the period, underperforming the U.S. Aggregate Index, a blend of taxable fixed income bonds, which returned -3.51%.i
Several factors drove the fixed income sell-off, including higher oil prices, which reignited inflation concerns, substantial new bond issuance from AI-related companies, and continued worries about national fiscal deficits. Strong expectations for GDP growth may have also helped drive higher Treasury yields toward the end of the quarter, which we discuss more in depth herein.
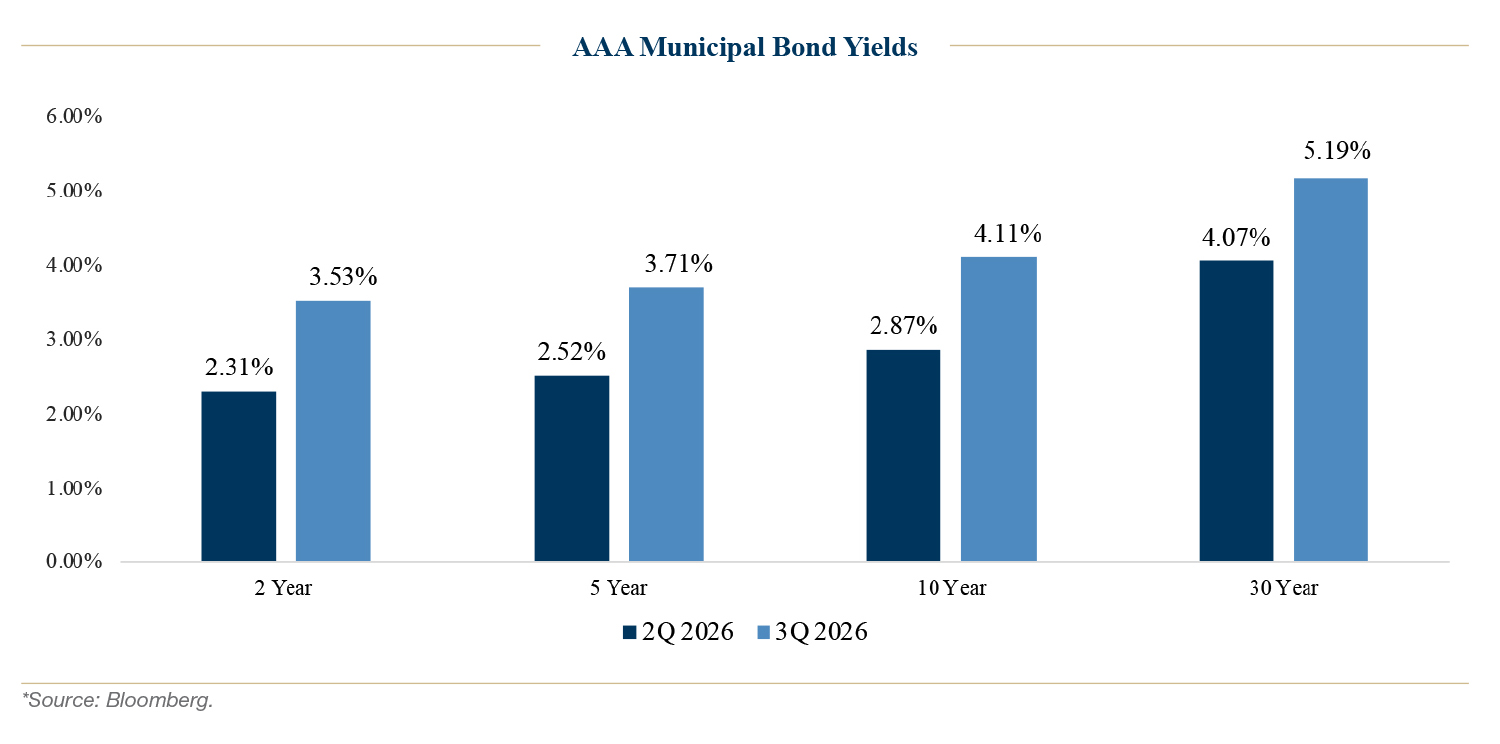
AAA-rated municipal bond yields rose 111-142 basis points during the quarter, with 15-year yields climbing the most.ii While higher U.S. Treasury rates helped pull municipal yields higher, record municipal new issue supply also contributed to the selloff.iii Outflows from municipal bond mutual funds surfaced in September, which was an additional factor in municipals’ underperformance versus taxable fixed income.iv Selling related to tax-loss harvesting also detracted from performance.
At the end of the quarter, the 10-year and 30-year AAA-rated municipal bond yields reached 4.11% and 5.19%, respectively, the highest since 2008 for the 10-year and 2011 for the 30-year.v vi
Duration-heavy sectors within the Bloomberg Municipal Index, such as housing and hospital bonds, tended to underperform the broader index, with these two sectors returning -7.42% and -7.41%, respectively. One outperforming sector was prepaid energy, which returned -3.76%, as spreads, the additional yield compared to top-rated AAA bonds, for prepaid energy tightened during the quarter. Incremental yield versus similarly rated bonds also boosted returns for the sector.vii
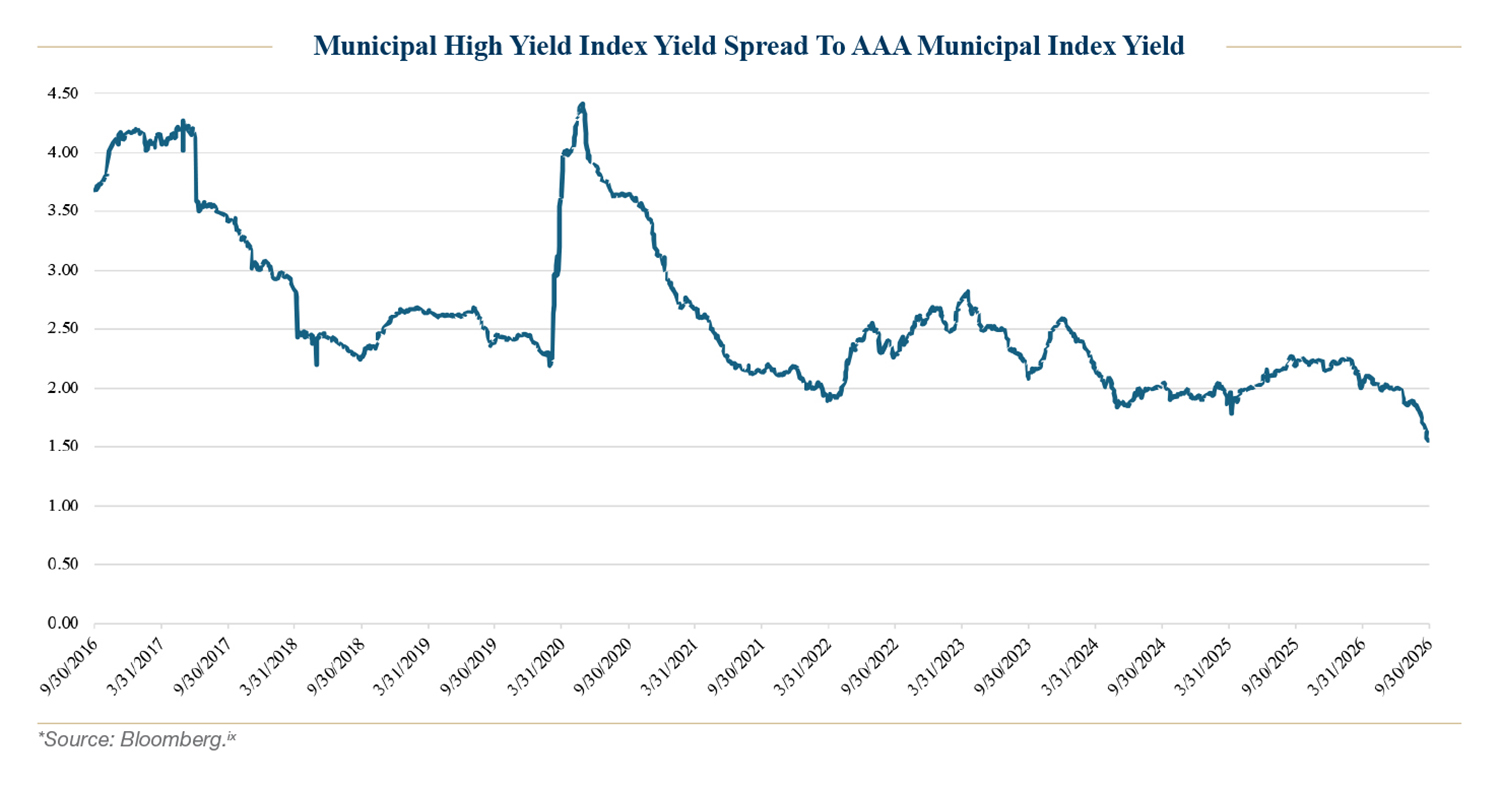
The high-yield segment outperformed investment-grade municipals, with the Bloomberg Municipal High Yield index returning -5.55%. However, high-yield municipal funds saw outflows for most of September, leading to performance roughly in line with the investment-grade index for that month.viii
The high-yield outperformance during the quarter led spreads at the index level toward their narrowest level in over a decade.
Compared with Treasuries, municipals underperformed notably across the curve, as municipal yields rose more than Treasury yields. Municipal/Treasury yield ratios rose 10-17 percentage points during the period, with the ratio for 2-year maturities rising most.x
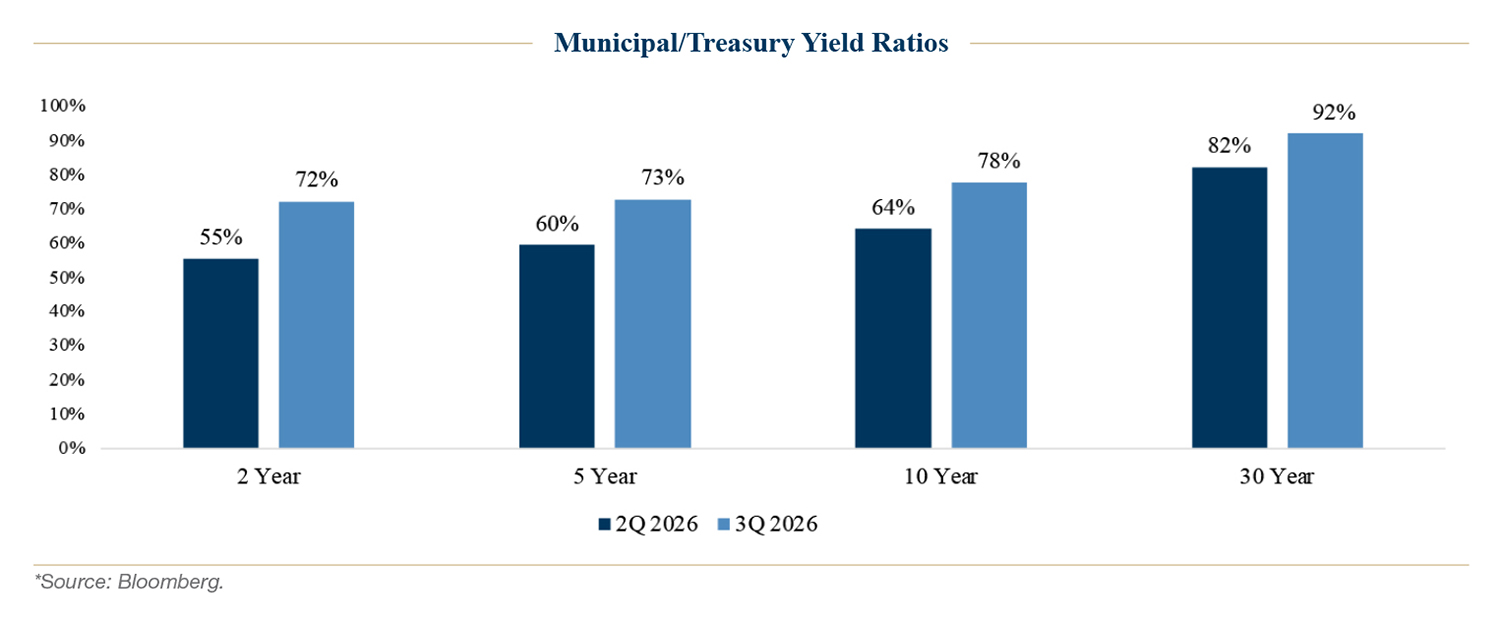
Toward the end of the quarter, municipal yields reached their highest (cheapest) levels relative to U.S. Treasuries in over a year for most maturities.xi
When all was said and done, the taxable-equivalent yield for the Bloomberg Municipal Bond Index ended the quarter at 8.07%*, yield levels not seen since 2008.
Economic Landscape – Strong Growth Expectations Accelerate Rising Yields
Economic data releases during the 3rd quarter were collectively robust. Consumer spending was strong, as evidenced by retail sales figures and real personal spending data in August.xiii xiv September’s S&P PMI data, a measure of business activity, showed economic output at its highest level since July 2021.xv
On the employment side, job growth was steady in the 3rd quarter. Monthly job growth averaged 71,000 over the last three months, while the unemployment rate ticked down from 4.2% in June to 4.1% for July and August.xvi
Corporate earnings growth also remained solid, with year-over-year earnings growth above 20% for the last two quarters, and expectations are that this will continue in 3Q.xvii
These data points, among others, are expected to drive strong GDP growth measures in 3Q. The widely followed Atlanta GDPNow estimates 3rd quarter real GDP growth at 3.7%, up from 2.2% reported for the 2nd quarter.xviii
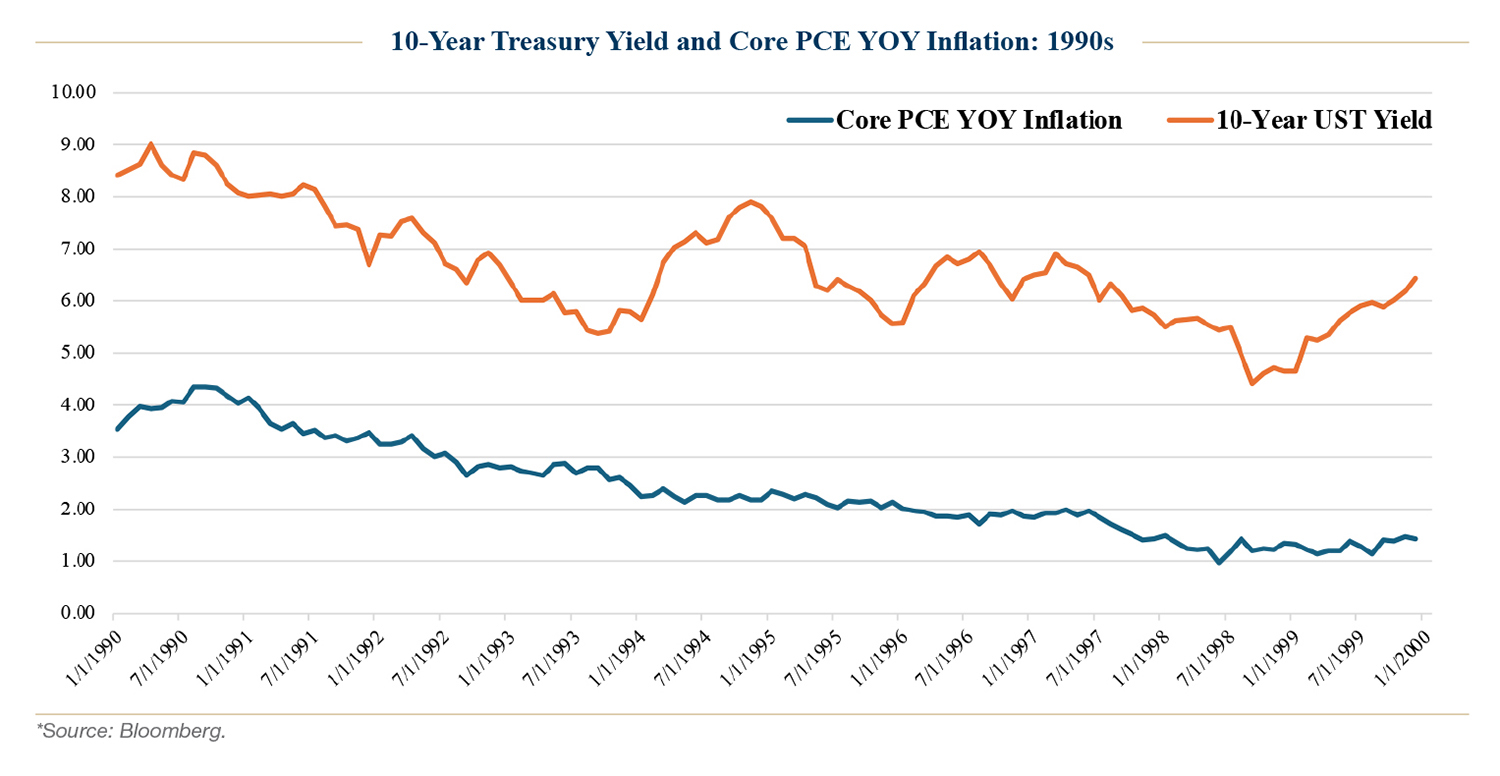
The potential for continued elevated GDP growth, supported by the AI buildout, may be another factor that contributed to the rising bond yields witnessed recently. While much focus is on inflation as a determinant of yield levels, economic growth also appears to be a key driver of intermediate- and long-maturity Treasury yields, as history shows.
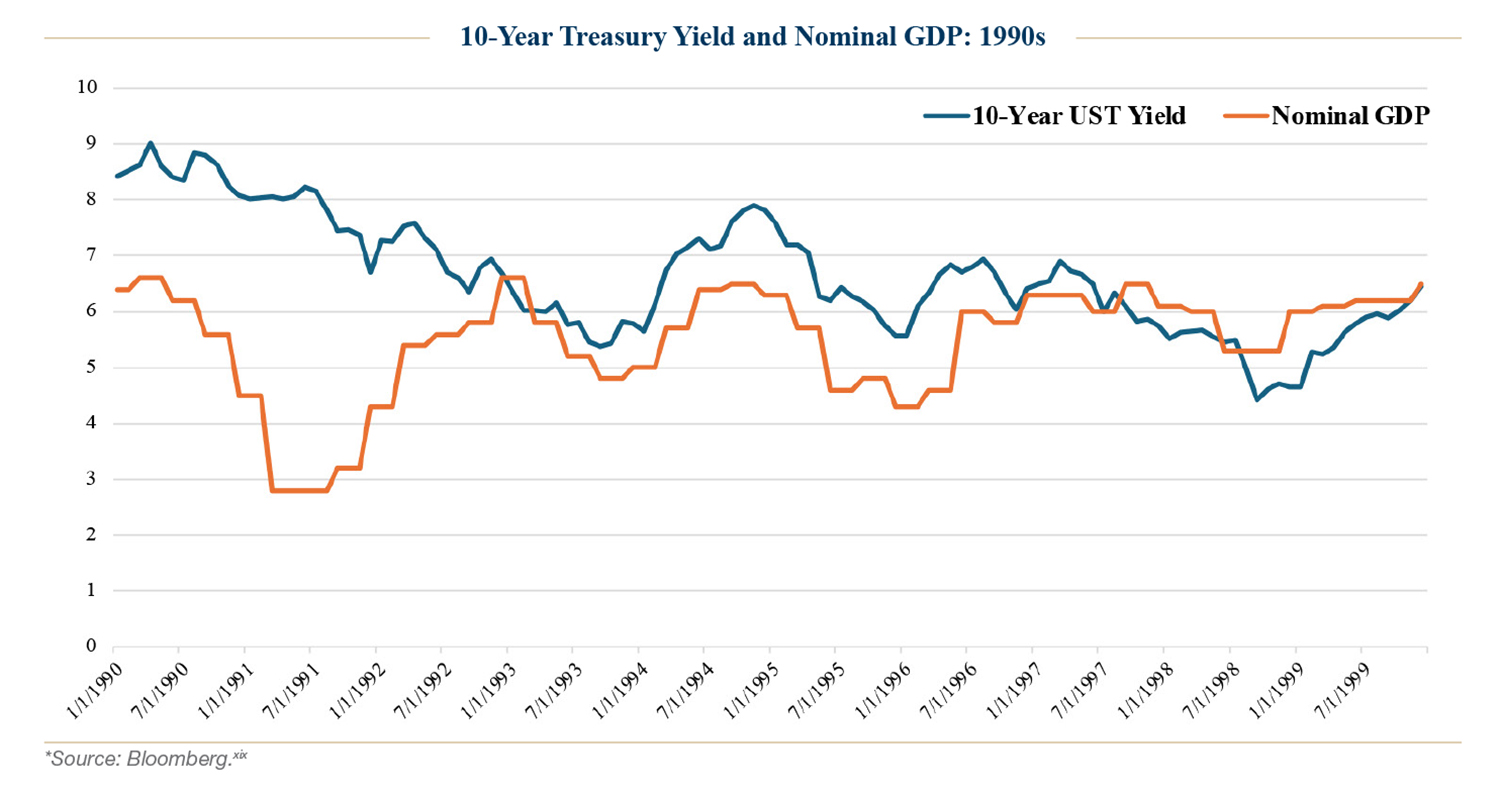
In fact, in the 1990s, core PCE inflation averaged just 1-2% in the latter part of the decade. Yet the 10-year Treasury rate was even higher than today, yielding above 6% for part of the period, with economic growth as a key driver.
The 10-year Treasury yield was notably correlated with nominal GDP during that time; a measure that incorporates both growth and inflation.
The Federal Reserve – The First-Rate Hike Since July 2023; Fed Signals Another Hike to Come
At the September meeting, the Fed raised the policy rate by 25 basis points to the 3.75-4.00% range, as expected. While core inflation, which excludes energy and food prices, did not rise meaningfully since the last FOMC meeting in July, the timing of how long it remained above the Fed’s 2.0% target became a key focus and appeared to prompt action. Strong economic data also supported the Committee’s decision to hike. Before the September meeting, Fed Funds futures markets priced in a 94% probability of a 25-basis-point increase.xx
The overall hawkish tone a month earlier during Chair Warsh’s speech at Jackson Hole appeared to set the stage for the September hike. In that speech, Warsh said underlying inflation trends had not meaningfully improved recently and that economic conditions were not restrictive on balance. The Fed Chair also removed speculation that inflation between 2% and 3% would be tolerated, and clarified that 2.0% is the firm goal. With core PCE, the Fed’s preferred measure of inflation, running at 3.4% year over year at that time, inflation remained far from the target. 3-month annualized figures for core PCE were also well above goal.
Looking ahead after September’s meeting, the Fed members’ median rate forecast called for 1 more 25 basis point hike in 2026, and a stable policy rate for 2027. Following strong economic data since the meeting, futures markets now price in a more aggressive Fed: 3 more hikes by April of 2027 with a potential 4th later in the year.xxi
Municipal Market Deeper Dive: Yields at New Highs, Credit Quality Intact, but “Catching the Falling Knife” Fears Prevent Stability
The municipal market posted negative returns each month during the quarter as bond yields rose, with the Bloomberg Municipal Bond Index posting -1.85% and -0.23% returns for July and August, respectively. In September, the index returned -4.36%, its worst monthly return since September 2008.xxii
Municipals were influenced by higher U.S. Treasury yields during the quarter. The 10-year Treasury yield rose 82 basis points as inflation concerns from higher oil prices, worries about the growing U.S. deficit, heavy bond supply from hyperscalers, and stronger GDP growth expectations all contributed to higher yields.
New issue tax-exempt supply came in at $167B for the quarter, slightly above last year’s record pace, which the market struggled to absorb during some weeks in the period. School district, hospital, and prepaid energy deals continued to help drive the substantial issuance totals.xxiii August issuance eclipsed the record for the highest monthly supply total for tax-exempt municipals.xxiv
Weaker demand also weighed on the municipal market and helped drive underperformance versus Treasuries during the quarter. Coupon and maturity payments to investors, which can support the market as that cash is reinvested, fell 35% in September compared to the summer months.xxv Second, inflows to municipal mutual funds and ETFs fizzled in September, with funds seeing weekly outflows during two weeks of the month. The mutual fund segment saw significant outflows even in weeks when total headline flows were positive.xxvi Tax loss harvesting may have played a role in some of the shift in flows from mutual funds to ETFs during the quarter.
Toward the end of the period, certain new-issue deals began to be postponed. This reduced weekly supply in the last week of September, a trend that could continue if municipal yields stay elevated. Many such refunding deals, when an issuer sells new bonds and uses the proceeds to call existing bonds, no longer produced an economic benefit to the issuer at the higher level of yields.
Notable Municipal Market Action in 3Q
One market observation, particularly toward the end of the quarter, was the heavy selling pressure as measured by ‘bid-wanted’ sell lists. The last week of September saw a record for weekly bid-wanted volume going back to at least 1996. The week prior was also very elevated.xxvii
While municipal mutual fund outflows in September helped to drive some of the bid-wanted volume, tax-loss harvesting was also a prime contributor to the heavy selling. Tax-loss harvesting was a key theme for the month, as investors realized losses in their portfolios for tax purposes, with the goal of reinvesting into higher book yields.
Bonds in the prepaid energy sector saw a flurry of tax-loss harvesting activity, driven by the notably large outstanding par amount per issue and the large number of unique issues. These characteristics led many bondholders to harvest losses and purchase a new prepaid bond, with the ability to keep the funding recipient constant.
Credit Review
As 3Q26 ended, the municipal credit narrative shifted from isolated, event-driven headlines to a broader credit inflection, as rating agency outlook revisions and rating action data began to align with the late-cycle view we have discussed since the start of the year.
In our view, the most notable themes were Moody’s revision of the U.S. cities and counties sector outlook to Negative; Moody’s Q2 rating revision data showing that downgrades outpaced upgrades; the debate over California’s wildfire liability reform and its implications for publicly owned utilities; the Treasury and IRS proposed rules that could strip federal tax-exempt status from certain private schools; and Brightline Holdings’ Chapter 11 filing.
Taken together, 3Q26 reinforced our expectation that credit dispersion will widen heading into 2027, placing a premium on issuer-level selectivity, balance sheet strength, and a detailed understanding of policy and structural risks across sectors.
Local Governments: Moody’s Revises Cities and Counties Outlook to Negative
In late July, Moody’s revised its outlook for the U.S. cities and counties sector to Negative from Stable, citing the expectation that operating costs will rise faster than revenues through 2027.xxviii Moody’s projects aggregate tax revenue growth of 2.6% in 2026 and 2.0% in 2027, below expected inflation of 3.0% and 2.5%, respectively. The resulting real revenue compression, combined with slower economic growth, rising labor and healthcare costs, and more expensive capital investment, will make structurally balanced operations harder to maintain without spending restraint.
Revenue growth is losing momentum. Property tax remains the primary and most supportive revenue source, but moderating property value appreciation is slowing gains, while sales tax growth is likely to soften as consumer spending and confidence weaken. Moody’s expects U.S. GDP growth of 1.9% in both 2026 and 2027, down from 2.8% in 2024 and 2.1% in 2025, and slower growth can increase service demand while constraining economically sensitive revenue. At the same time, affordability pressures and resistance to tax increases may reduce voter support for the tax and fee measures that have historically supplemented local revenue growth.
Expenditure pressure remains elevated. Wages, benefits, and healthcare costs will keep operating spending high, and infrastructure costs are rising as deferred maintenance accumulates, median asset depreciation ratios remain above 50%, and construction costs outpace general inflation. As a result, capital decisions will become harder, and local governments may need to defer projects, reduce scope, or borrow more, increasing leverage and reducing financial flexibility.
In our view, the principal near-term risk is not an abrupt revenue decline, but a sustained mismatch between nominal revenue growth and faster growth in recurring and capital costs. The revision reaffirms our January 2026 outlook for the local government sector.xxix We expect pressure to build as local governments address likely reduced state support, less federal funding, and/or issues related to FEMA funding, with these concerns heightened during state budget negotiations and as we head into 2027. Governments with strong reserves, conservative budgeting, flexible labor and service structures, and manageable capital plans should be better positioned, while issuers with limited tax flexibility, high fixed costs, aging infrastructure, or weak affordability metrics are more exposed to operating erosion and rising leverage.
Rating Revisions: Downgrades Exceed Upgrades in Q2 2026
Moody’s Q2 2026 rating revision data supports our view that municipal credit conditions are moving past peak credit. Public finance downgrades exceeded upgrades by 116 to 96 in Q2 2026, reversing the more favorable trend seen in Q1 and signaling that rating agency actions are beginning to catch up with the credit inflection we have discussed since the start of the year.xxx
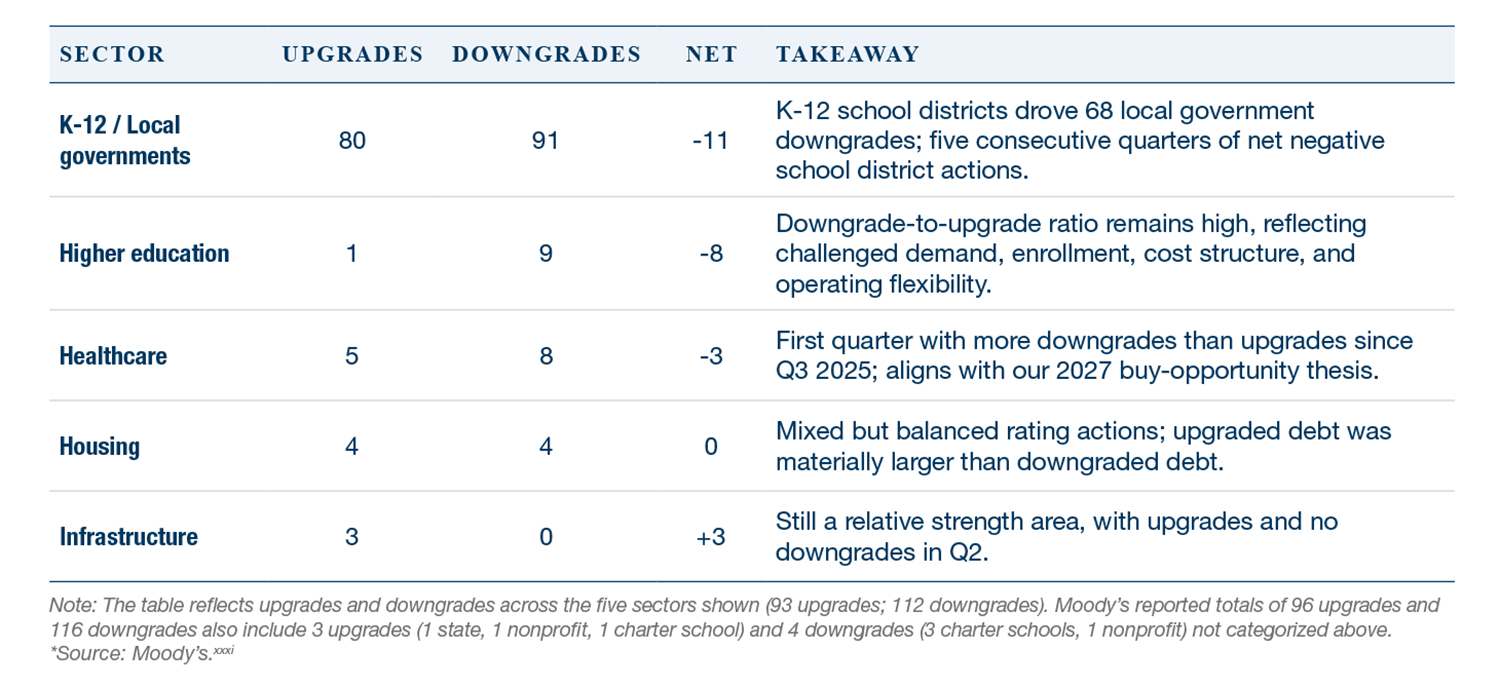
The negative signal is concentrated in education and emerging in healthcare. K-12 school districts have now recorded more downgrades than upgrades for five consecutive quarters, while higher education continued to show a high downgrade-to-upgrade ratio. Not-for-profit healthcare also recorded more downgrades than upgrades for the first time since Q3 2025, which is notable given the sector’s operating margin pressure, labor cost sensitivity, and looming 2027 policy and reimbursement risks.
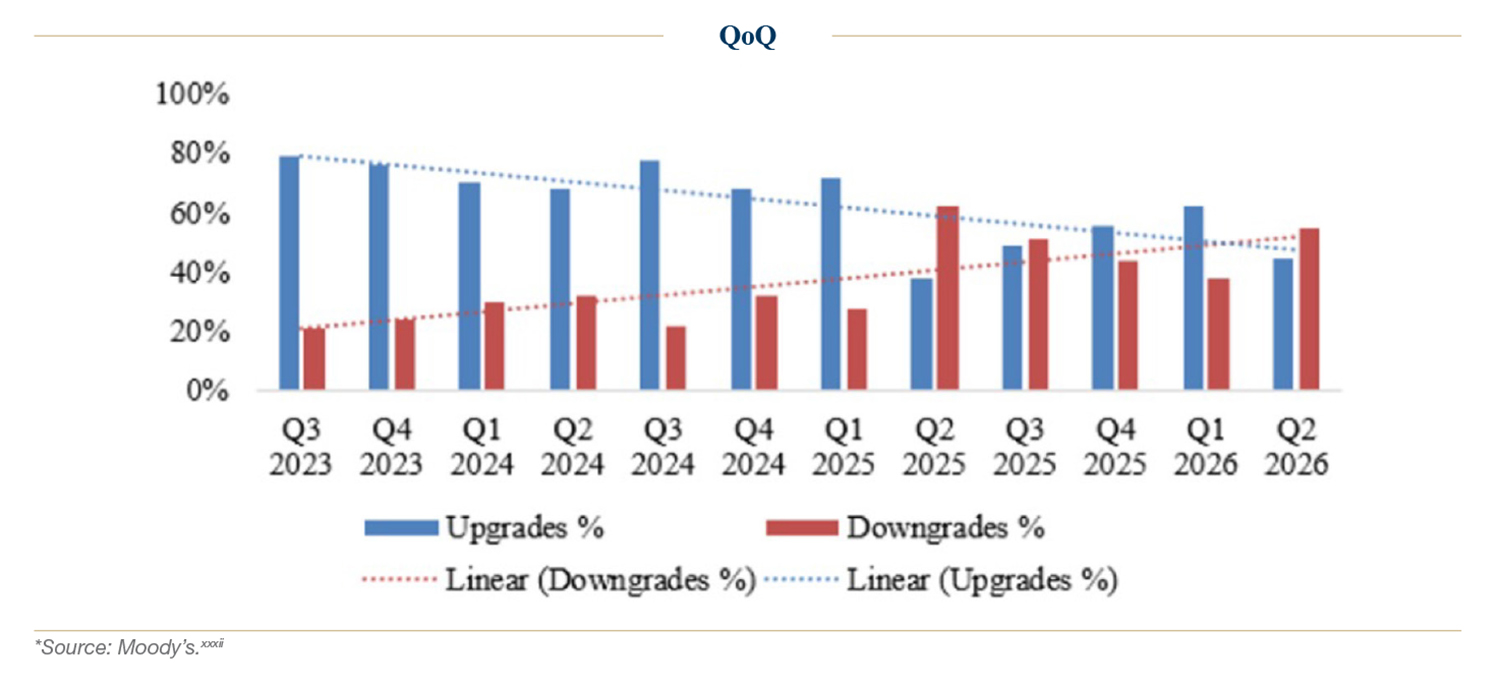
In our view, the data does not imply broad-based credit deterioration across public finance. Moody’s still characterizes fundamentals as broadly supportive, citing stable employment, resilient tax and revenue bases, and generally conservative fiscal management. The more important takeaway to us is selectivity. For hospitals, timing matters, as the first net negative healthcare quarter since Q3 2025 suggests the sector may be entering the window where rating actions, operating data, and policy risk converge. We expect 2027 to be a critical year for hospitals that should create attractive buy opportunities where spread widening or rating pressure overstates durable credit impairment.
California Wildfire Liability Reform and the Cross-Read to Publicly Owned Utilities
California lawmakers are resisting Governor Newsom’s proposal to limit insurers’ subrogation claims against investor-owned utilities (IOUs), underscoring the continuing political difficulty of reallocating wildfire costs among utilities, insurers, ratepayers, and shareholders.xxxiii A Senate proposal would have preserved insurers’ ability to pursue utilities for reimbursement of claims paid to policyholders. The proposal also contemplated additional utility penalties and potential constraints on rate increases, including limits on executive compensation following utility-caused wildfires and a requirement that regulators initially consider rate increases in line with inflation, with the California Public Utilities Commission (CPUC) retaining discretion to approve higher increases.
IOUs have warned that failure to materially reduce wildfire liability could affect capital allocation and credit ratings. From a municipal credit perspective, the debate is important because it highlights the comparatively stronger statutory and regulatory framework available to large California IOUs relative to municipal-owned utilities (MOUs).xxxiv
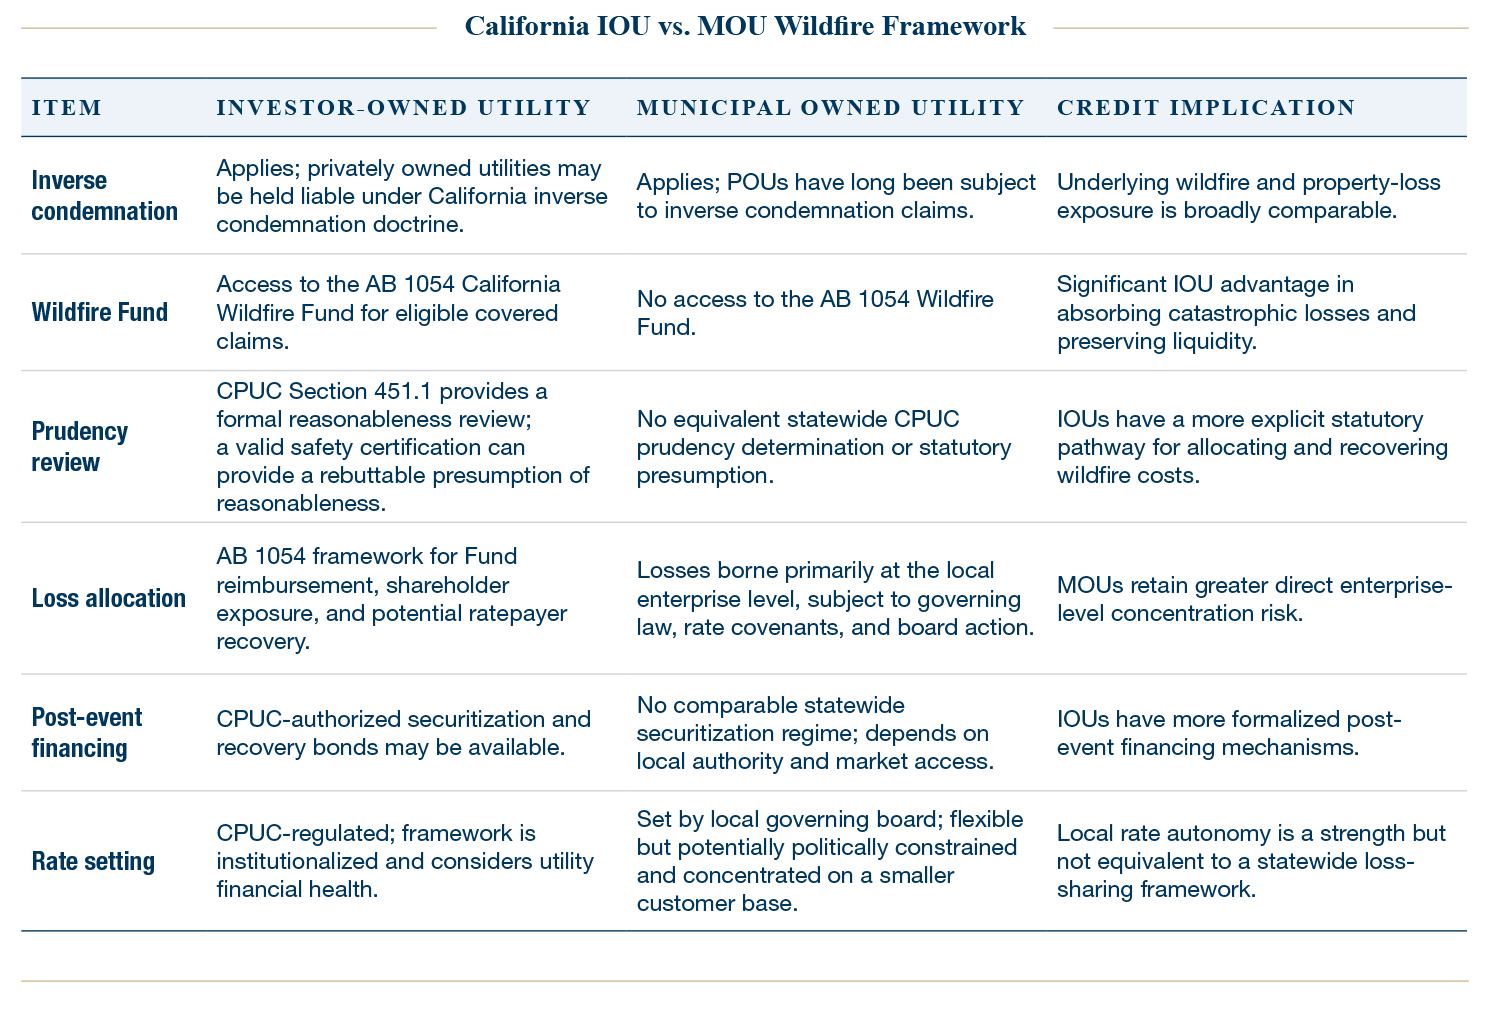
In our view, California MOUs with material transmission and distribution exposure remain structurally disadvantaged relative to the large IOUs from a wildfire liability and recovery standpoint. The key distinction is not inverse condemnation itself, which applies to both, but rather the absence of comparable statewide mechanisms for MOUs to finance or recover catastrophic wildfire losses.
Higher Education: Proposed IRS Rules on Tax-Exempt Status of Private Schools
On September 3, 2026, Treasury and the IRS proposed rules that would strip federal tax-exempt status from higher education institutions (“private schools”) whose admissions, financial aid and scholarships, or other school-supported programming are determined to be racially discriminatory if based on race, color, or national or ethnic origin.xxxv The rules will first go through a comment period and would take effect for taxable years beginning on or after May 31, 2027. Treasury estimates that roughly 18,000 institutions could be affected.
An affected institution could face federal income tax, lose the ability to issue tax-exempt debt, and see donors lose the individual tax deduction on gifts. Importantly, the treatment of already outstanding tax-exempt bonds if an institution’s exemption were revoked is unknown, which represents an unresolved risk for existing bondholders.
IRS revocation of a college’s tax-exempt status is exceedingly rare. The reference case is Bob Jones University, which lost its exemption in 1976 over its ban on interracial relationships and regained it in 2017. The proposal affirms our Negative view on the sector.xxxvi Regional disparities in full-time equivalent (FTE) demand growth should continue to drive underperforming and outperforming credit profiles. We continue to expect additional closings and bankruptcy filings among smaller, non-essential schools.
Brightline Holdings’ Chapter 11 Filing
On 9/24, Brightline Holdings LLC and certain parent entities filed for Chapter 11 in the District of New Jersey, listing assets and liabilities each in the $1B to $10B range, after years of revenue running below projections.xxxvii The operating company is excluded from the filing, so trains will continue running through the restructuring. Brightline is backed by Fortress Investment Group, and Assured Guaranty insures a majority of the senior tax-exempt bonds of Brightline Trains Florida LLC.
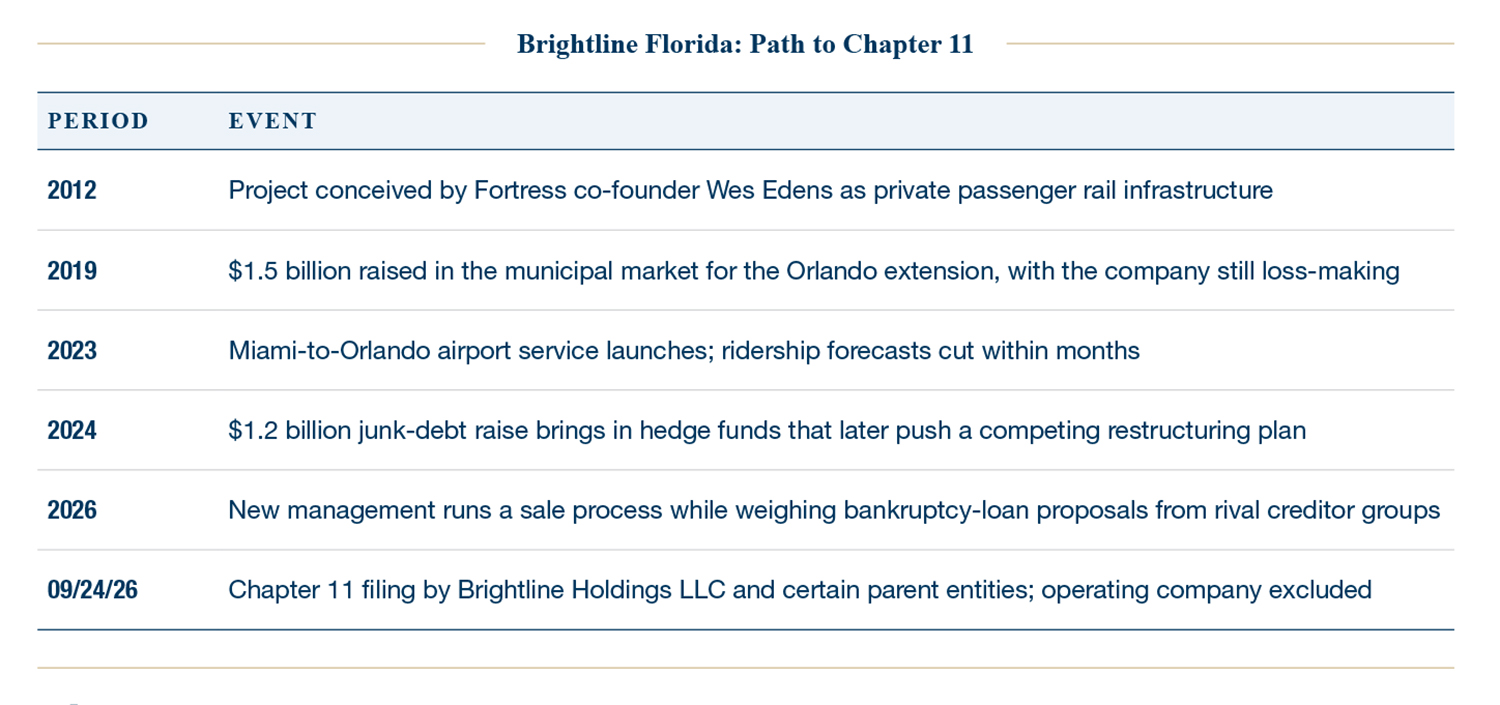
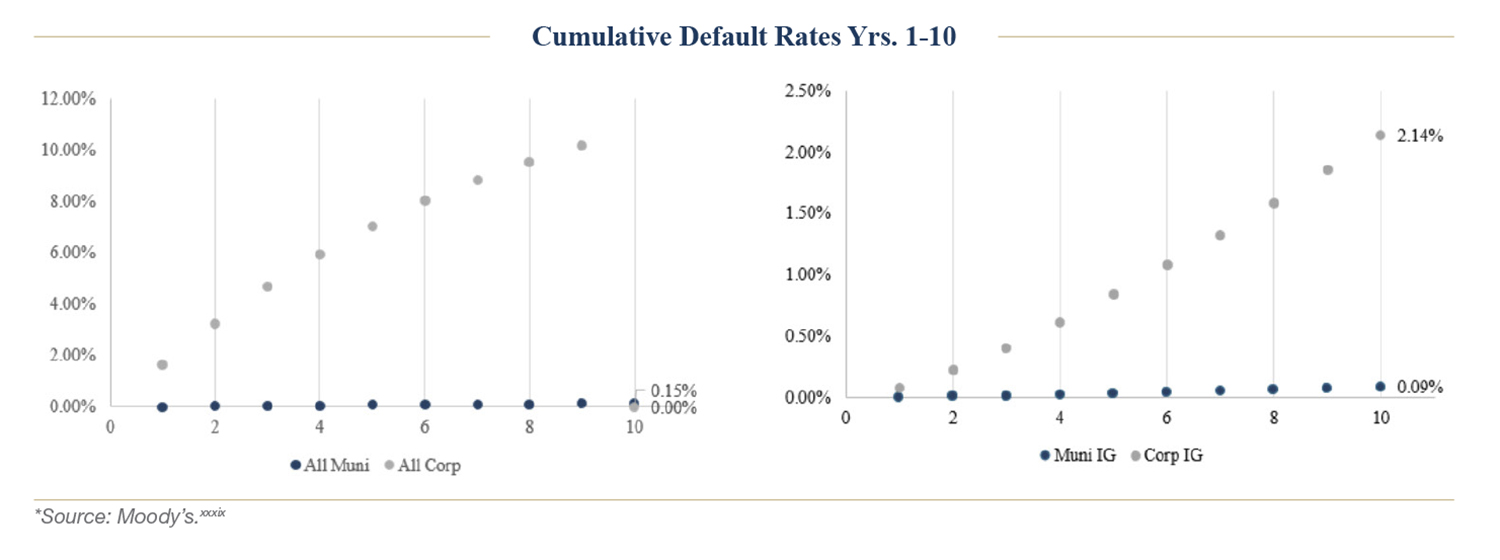
While the filing is being labeled as one of the largest U.S. municipal bond defaults, Brightline is far from a traditional municipal credit. At a fundamental level, Brightline is a corporate credit that can issue tax-exempt debt through the USDOT Private Activity Bonds program. As the chart below shows, our conclusion is that municipal bonds remain one of the safest asset classes, with high recovery rates and extremely low defaults.xxxviii
Conclusion
The third quarter serves as a reminder that higher yields can be both a source of volatility and a source of future return. Municipal investors entered the period with relatively tight valuations and exited with substantially higher income potential, more favorable ratios to Treasuries, and a wider range of securities requiring careful credit judgment. The adjustment may not yet be complete. Economic strength, inflation, fiscal concerns, and the path of Federal Reserve policy remain capable of keeping rates volatile, while heavy selling and shifting fund flows could continue to affect market technicals.
Against that backdrop, we believe selectivity will matter more heading into 2027. Municipal credit fundamentals remain broadly supportive, but rating trends and sector-specific pressures argue against treating the market as a single asset class. Strong balance sheets, durable revenue sources, and financial flexibility should become increasingly important differentiators. For long-term investors who can withstand near-term volatility, we believe the third-quarter repricing has created a more compelling starting point for income, but one that rewards disciplined security selection and close attention to underlying credit quality.
ii Bloomberg
iii See Endnote ii
iv Lipper
v See Endnote ii
vi JPMorgan
vii See Endnote i
viii See Endnote iv
ix Bloomberg Municipal High Yield Index, Bloomberg AAA Index, Yield to Worst
x See Endnote ii
xi See Endnote ii
xii Bloomberg, Municipal Bond Index Yield To Worst. Taxable Equivalent yield uses a top Federal tax rate of 40.8% from 2018-2026, 43.4% from 2013-2017, and 35% from 2008-2012
xiii U.S. Census Bureau
xiv Bureau of Economic Analysis
xv S&P Global
xvi Bureau of Labor Statistics
xvii Factset https://advantage.factset.com/hubfs/Website/Resources%20Section/Research%20Desk/Earnings%20Insight/EarningsInsight_092526.pdf
xviii See endnote xii
xix Bloomberg, BEA. Nominal GDP: U.S. GDP Nominal Dollars YOY
xx See endnote ii
xxi See endnote ii
xxii See endnote i
xxiii See endnote ii
xxiv JPMorgan
xxv See endnote ii
xxvi See endnote iv
xxvii See endnote ii
xxviii Moody’s Ratings: U.S. Cities and Counties Sector Outlook revised to Negative from Stable (July 2026)
xxix AMPWP: January 2026 Municipal Sector Outlook – Local Governments (January 2026)
xxx Moody’s Ratings: Rating revisions – Downgrades exceeded upgrades in Q2 2026 (08.14.26)
xxxi Moody’s Ratings, Rating revisions – Downgrades exceeded upgrades in Q2 2026 (08.14.26)
xxxii Moody’s Public Finance Upgrades and Downgrades as a Share of Total Rating Actions, Q3 2023–Q2 2026. Source: Moody’s Ratings (08.14.26)
xxxiii California Assembly Bill 1054 (2019); California Public Utilities Code § 451.1, California Wildfire Liability Reform and the Cross-Read to Publicly Owned Utilities (August 2026)
xxxiv California Assembly Bill 1054 (Stats. 2019, ch. 79), establishing the California Wildfire Fund; California Public Utilities Code § 451.1
xxxv U.S. Department of the Treasury and Internal Revenue Service: Notice of Proposed Rulemaking, REG-119986-25 (09.03.26)
xxxvi AMPWP January 2026 Municipal Sector Outlook – Higher Education (January 2026)
xxxvii Brightline Holdings LLC et al., Voluntary Petitions under Chapter 11, U.S. Bankruptcy Court for the District of New Jersey (filed 09.24.26)
xxxviii Moody’s Ratings: U.S. Municipal Bond Default & Recovery Rates, 1974–2024 (August 2025)
xxxix Moody’s U.S. Municipal Bond Default & Recovery Rates, 1974–2024
Disclosure
A&M Private Wealth Partners, LLC (“AMPWP”) is an SEC-registered investment adviser. SEC registration does not imply a certain level of skill or training. For additional information on the services AMPWP provides, as well as our fees for such services, please review our Form ADV at adviserinfo.sec.gov, contact us at 300 Banyan Boulevard, 10th Floor, West Palm Beach, FL 33401, or call us at (561) 268-0900.
This piece and its content reflect AMPWP’s views at the time of its writing, and the information presented and AMPWP’s views are for informational purposes only. Such views are subject to change at any time without notice including due to changes in market or economic conditions, and forward-looking statements or forecasts are based on assumptions and may not be realized. Future events and outcomes are inherently uncertain. Statements are subject to risks and uncertainties that could cause actual outcomes to differ. AMPWP has obtained information provided herein from various third-party sources believed to be reliable, however, such information is not guaranteed and is subject to errors, omissions, and changes. No reliance should be placed on the views and information presented when making any investment or liquidation decision. AMPWP is not responsible for the consequences of any decisions or actions taken or not taken as a result of the views and information presented, and AMPWP does not warrant or guarantee the accuracy or completeness of this piece or information presented.
Additional content may be relevant for further context or other insight. Portfolios should also be viewed in the context of the broad market and general economic conditions prevailing during the periods covered by performance and other information. Any references to future returns and/or risk are not promises of the actual return a portfolio may achieve nor do they reflect all risks. Not all investments are suitable for all investors. All investments involve risk of loss, including to principal, and all investors must be prepared to bear such loss. Different securities, strategies, and allocations have different costs and risks, and diversification also does not assure a profit nor protect against a loss. Past performance is not a guarantee of future results. Additionally, changes in investment strategies, contributions, or withdrawals may materially alter results, as may market conditions, other factors including but not limited to economic factors, fees, expenses, and events. Nothing herein should be construed as an investment recommendation. AMPWP does not provide legal, accounting, or tax advice, and AMPWP’s services are not intended to act as a substitute for such advice. AMPWP encourages you to seek the counsel of a qualified attorney and/or accountant for legal, accounting, or tax advice.