


- The municipal market posted a positive second quarter, supported by steady demand, strong mutual-fund inflows, and renewed interest in longer-duration bonds.
- Labor market data softened over the quarter, while headline inflation rose as energy prices increased. The Federal Reserve kept its target range at 3.50% to 3.75% at both the April and June meetings.
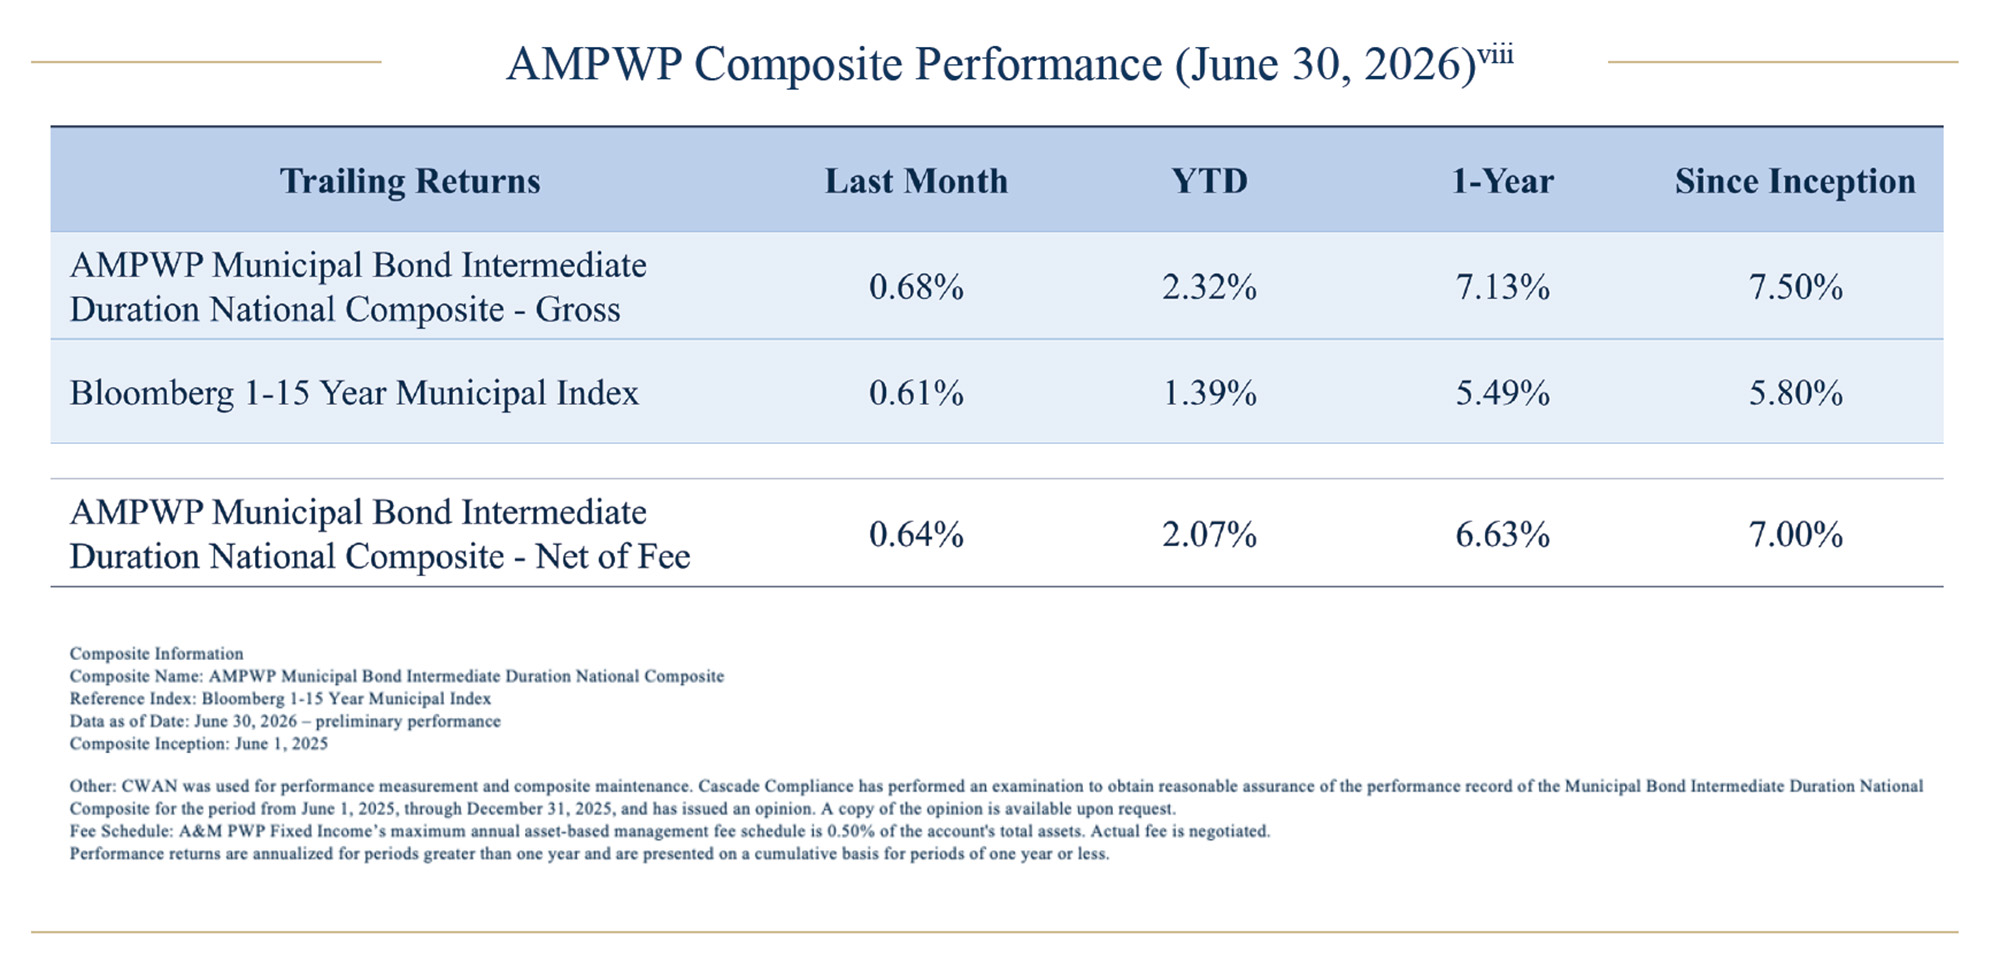
- Over the past 12 months, AMPWP Municipal Bond Intermediate National Composite trailing returns were 7.13%, compared with Bloomberg 1 – 15-year Municipal Index trailing returns of 5.49% (as of 6/30/26).
- Credit attention remained focused on policy- and event-driven risks, including Florida’s November property tax ballot measure, rating agency commentary on Florida local governments, and ongoing examination of the Gas and Electric Prepay sector.
Introduction
The first half of 2026 offered a useful reminder that municipal performance is often shaped by two forces operating simultaneously: the broad direction of rates and the local details of credit. In the second quarter, municipals benefited from demand for tax-exempt income, a supportive technical backdrop, and renewed interest in longer-duration bonds. At the same time, the credit landscape remained nuanced. Policy proposals, rating agency actions, and the continued growth of complex sectors such as Gas and Electric Prepays reinforced the need for security-level analysis rather than broad market assumptions.
Market Environment
Hiring in the 2nd quarter slowed over the quarter, with nonfarm payrolls reported at 148,000 in April, 129,000 in May, and 57,000 in June, for a three-month average of approximately 111,000. The unemployment rate was 4.2% in June, while average hourly earnings grew 3.5% year over year.i The job market remained resilient in the quarter, but growth slowed materially from earlier in the year.
May CPI rose 0.5% month over month and 4.2% year over year, up from 3.8% year over year in April. Core CPI was much calmer at 0.2% month over month and 2.9% year over year.ii Headline inflation was pushed higher by energy, which was up 23.5% year over year.iii The Fed’s preferred PCE measure also moved higher: the May PCE price index rose 0.4% month over month and 4.1% year over year, while core PCE was 3.4% year over year.iv v
The Federal Reserve held steady throughout the quarter. The FOMC kept the federal funds target range at 3.50%–3.75% at both the April 29 and June 17 meetings. By the end of the quarter, the market was still working to understand the new direction of the Warsh-led Federal Reserve.vi
Municipal Market Performance
The Bloomberg Municipal Bond Index returned 250 basis points in the 2nd quarter. Long-maturity bonds were the top performers, with those maturing 22 years or longer returning 424 basis points, compared with short maturities returning 76 basis points. Lower investment-grade outperformed, with BBB-rated bonds up 347 basis points in the 2nd quarter, while AAA-rated municipals returned 249 basis points.
In the quarter, new issuance remained very heavy, with $157 billion in municipal issuance. Despite the heavy issuance, the market easily absorbed the new supply, as mutual fund inflows remained very strong. Municipal mutual funds took in about $27 billion in flows in the 2nd quarter of 2026. Most of the inflows were focused on long-duration funds, a drastic change from last year’s demand.vii
As municipals largely outperformed U.S. Treasuries across the curve, their relative value became less attractive. High-quality municipal bonds on the front end of the curve ended the quarter at levels that made U.S. Treasuries a better option on an after-tax basis.
Performance Drivers
Composite outperformance to the benchmark was driven by two distinct periods. From June through December 2025, performance was supported by sector allocation, including AMT airport bonds; duration positioning, as yields declined 30 to 60 basis points over the period; and security selection. From January through May 2026, yield-curve positioning was a primary driver, with an overweight in the 17- to 20-year range.
Income (or income return) also contributed to the outperformance; the composite yielded an average of about 30 basis points more than the index, driven by yield-curve positioning and sector overweights.
Credit Outlook
As the 2nd quarter came to a close, the municipal credit narrative continued to be driven by a concentrated set of policy and rating-agency actions, along with heightened attention to the Gas and Electric Prepay sector. In our view, the most notable themes were Florida’s November Property Tax Ballot Measure and related rating agency actions, as well as increased attention on Gas and Electric Prepay bonds.
Taken together, the 2nd quarter reinforced our focus on exposure to policy- and event-driven credit-related risks within the municipal market and on maintaining a detailed understanding of sector-related intricacies.
Florida’s November Property Tax Ballot Measure
Florida lawmakers voted on June 2, 2026 to place a question on the November ballot asking voters to decide whether to phase out property taxes for most primary residences in the state. The proposal will ask voters to approve a constitutional amendment that would create a $250,000 property tax exemption for Florida’s homestead, or primary residence, properties. The current exemption is capped at an assessed value of $50,000, and the change would eliminate property taxes for about 60% of the state’s residents. Homestead property exemptions apply to the first $25,000 of assessed value, with a second $25,000 exemption.ix
If passed by at least 60% of voters in November, the ballot initiative would allow the Governor and the legislature to set a schedule to raise the exemption over a two-year period. The proposed changes would affect ad valorem tax revenues for cities, counties, and water, fire, and mosquito control districts; school districts would be exempt. If approved by voters, the amendment is structured to take effect on January 1, 2027.x
Following the passage of the ballot measure, rating agencies took action. Fitch released a report stating that credit pressure on some Florida local governments could increase if residents approve a constitutional amendment this November to reshape the property tax framework.xi S&P released a similar statement, citing concerns. According to S&P, local governments in Florida will face greater credit pressure if voters approve a plan to largely eliminate property taxes on more than half of the state’s homes.xii
According to Fitch, some local governments may offset lower recurring property tax revenues through expenditure cuts, service reductions, or the use of reserves. Fitch stated that a sustained decline in available reserves could lead to a downward adjustment of an issuer’s financial resilience assessment, depending on the magnitude. Increasing other revenue streams, including non-ad valorem revenue and fees and charges, could increase exposure to economically sensitive revenue or concentrate the tax burden among certain non-homestead taxpayers, including commercial property owners.xiii
The Gas and Electric Prepay Sector
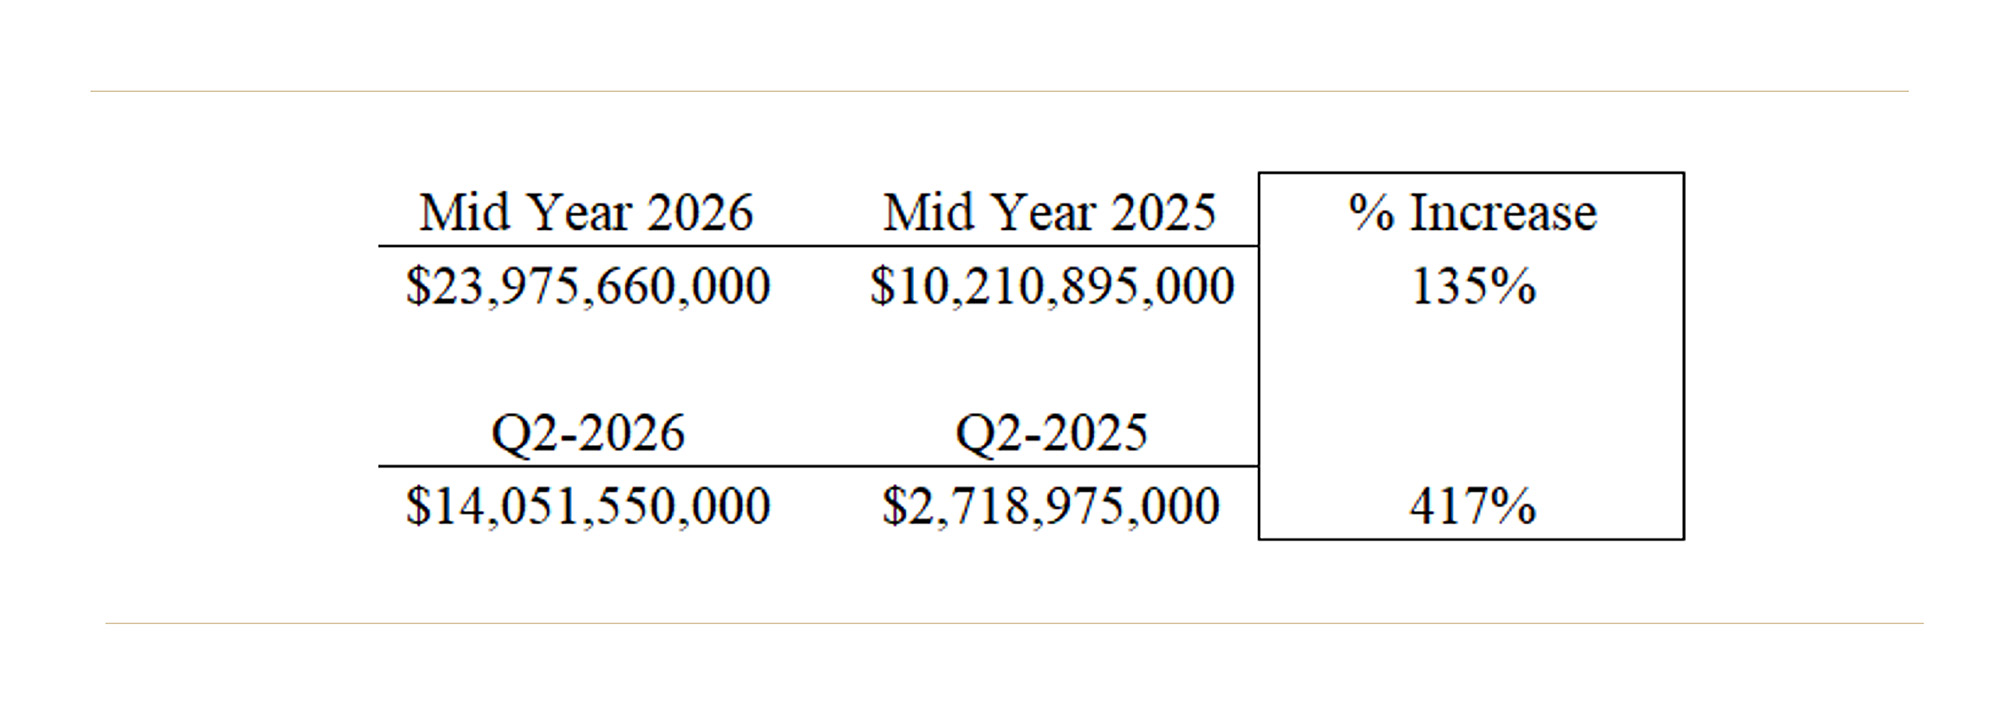
On a 2nd quarter 2026 over a 2nd quarter 2025 basis, issuance levels remained at a record pace.xiv The record pace in issuance was likely driven by a combination of the entry of new funding recipients and greater retail investor participation.
Background Funding Recipients
The history of funding recipients reflects the market’s evolution. From around 2006 to 2018, major U.S. financial institutions held this role. Banks with trading and physical energy operations provided the balance sheets and execution platforms needed for prepayments. The landscape began to diversify in 2019, when Macquarie engaged in a Main Street Natural Gas transaction. BP later participated in a Kentucky Public Energy Authority deal. Royal Bank of Canada took part in a Black Belt Energy transaction in 2021. The period from 2023 to 2025 marked a major turning point. Insurance companies became the largest recipients of funding. American General Life, New York Life, Athene, Pacific Life, and others participated in multiple California community choice deals and regional issuances.xv
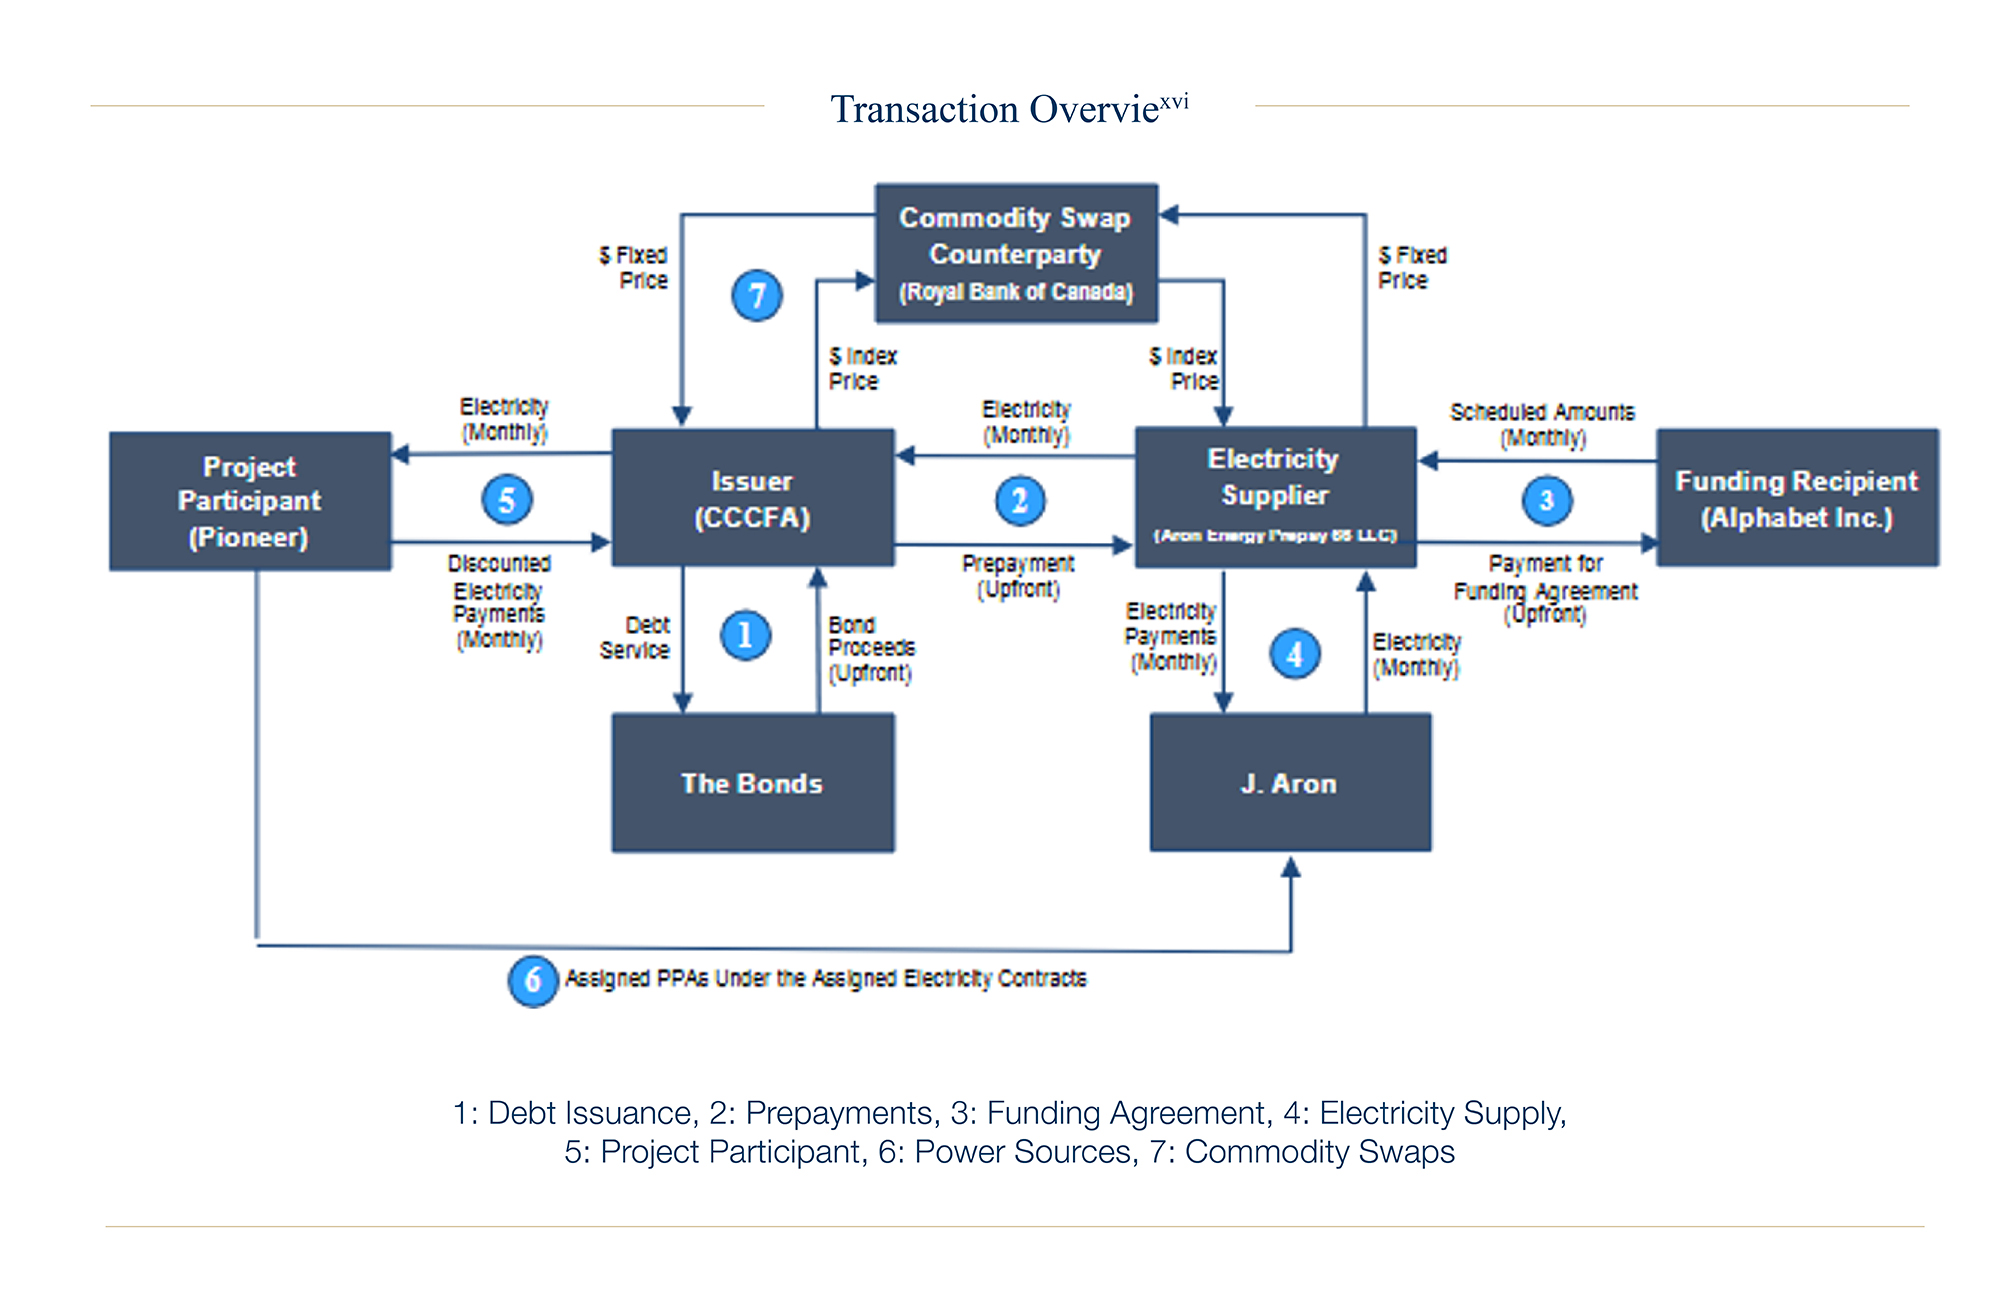
In June of this year, the California Community Choice Financing Authority (CCCFA) issued the Series 2026E $1,197,070,000 Clean Energy Project Revenue Bonds (CUSIP 13013JJD9). The CCCFA used the bond proceeds to prepay Aron Energy Prepay 66 LLC (the Electricity Supplier) for the delivery of a specified quantity of electricity over a 30-year period pursuant to Power Purchase Agreements (PPAs). CCCFA sold the electricity acquired under the PPAs to Pioneer Community Energy (the Project Participant), which then used it to provide electricity to its retail customers. The prepayment amount ($1,197,070,000) was loaned to Alphabet Inc. (Alphabet / Google) pursuant to the Funding Agreement (referred to as the Funding Recipient).
Transaction Overviewxvi
2026 Midyear Municipal Credit Sector Outlook
At the midpoint of 2026, our municipal credit research views remain broadly on track with the forecasts and sector expectations outlined in our 2026 Credit Sector Outlook & Issuance Forecast. Year-to-date market activity has reinforced several of our core views, particularly in sectors where we expected elevated issuance, heightened investor scrutiny, and continued credit differentiation.
Three sectors have stood out most clearly in relation to our original 2026 expectations:
- Hospitals
- Gas & Electric Prepays
- Public Power & Utilities (combined power and water)
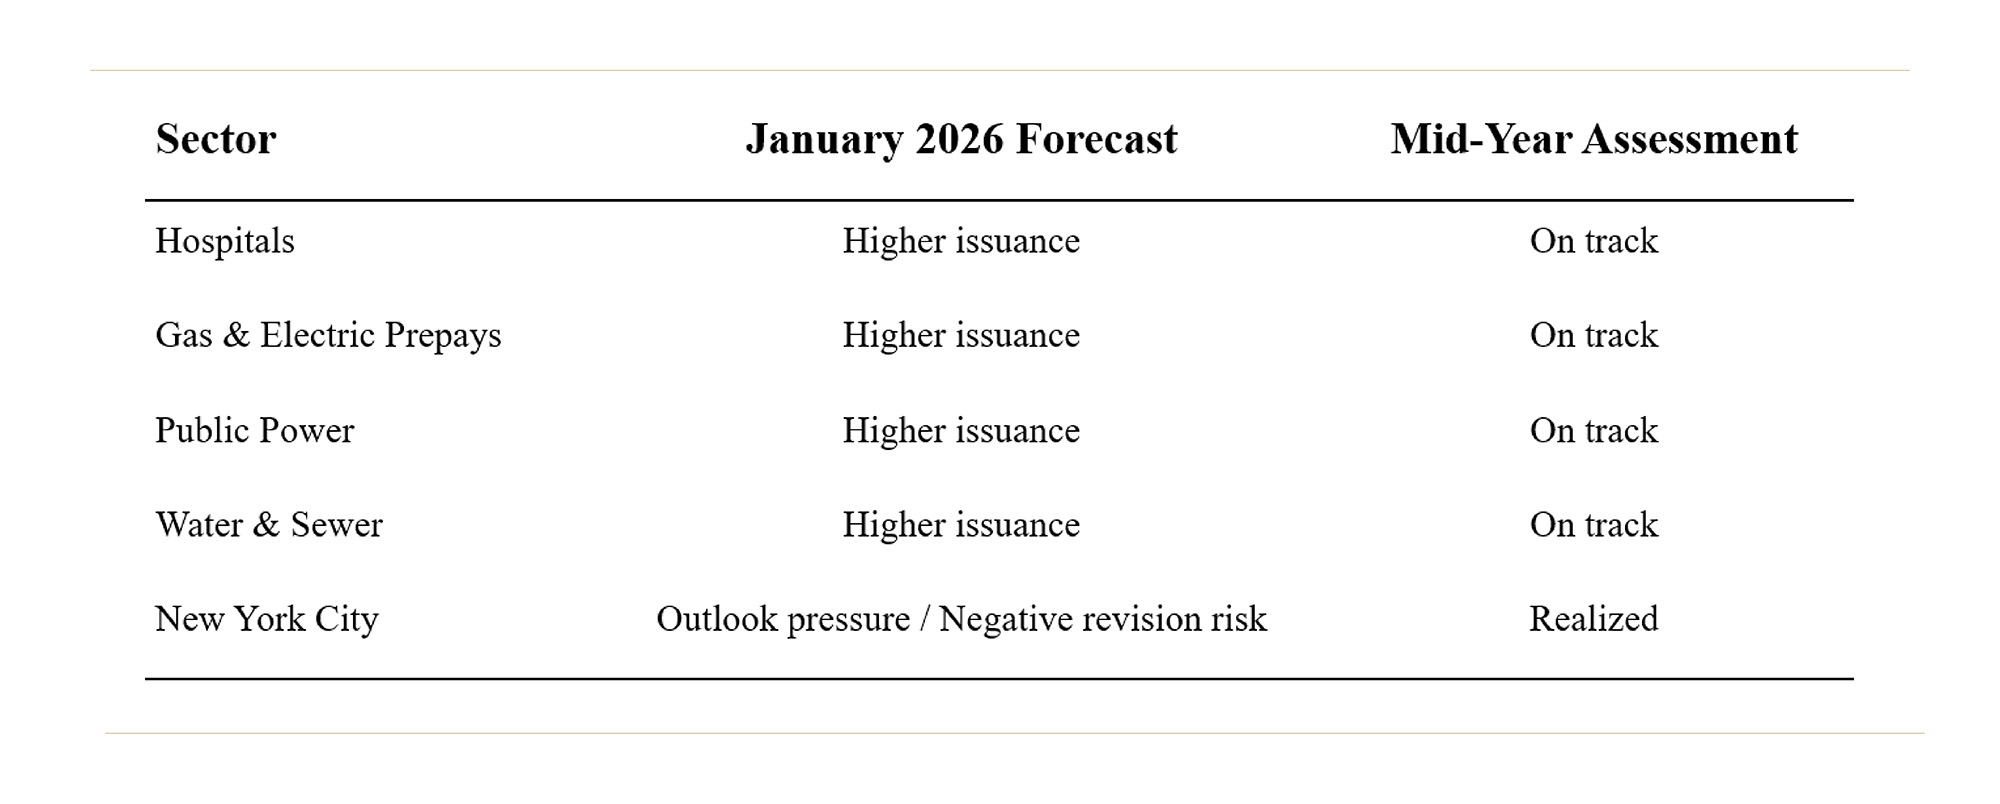
In each of these areas, issuance trends have aligned with our January 2026 forecast of higher activity. This reinforces the value of a sector-specific credit framework that integrates issuance expectations, structural analysis, rating-agency sensitivity, and issuer-level credit fundamentals. Our research process has also proven effective at identifying issuer-specific credit pressure. In our December publication on New York City, we anticipated that rating agencies could revise the City’s outlook from Stable to Negative. That call was validated in March 2026, when both Moody’s and Fitch revised New York City’s outlook to Negative.
Issuance Trends: Core Sector Forecasts Remain on Track
Municipal issuance has remained strong through the first half of 2026, with several sectors posting meaningful year-over-year gains. As noted in JPMorgan’s June 5, 2026 Municipal Markets commentary: “By sector, issuance remains strong, with large y/y gains in prepays (+94%), hospitals (+62%), public power (+53%) and utilities (+51%).”
These year-to-date trends are directionally consistent with our January 2026 forecasts, which called for higher issuance across the following sectors:
The strength in issuance across these areas reflects a combination of capital needs, refinancing opportunities, infrastructure investment requirements, and sector-specific financing dynamics. It also underscores the importance of evaluating not only issuance volume but also credit quality, structural complexity, and investor protections embedded in each transaction.
Gas & Electric Prepays: Sector Outlook Revised to Stable (-)
One notable change to our 2026 Sector Outlook occurred in April, when we revised our outlook for the Gas & Electric Prepay sector from Stable to Stable (-).
This revision was driven by several factors:
- First, issuance has reached historically elevated levels, increasing the need for careful, transaction-by-transaction analysis.
- Second, structures have become more complex, with additional contractual layers and a broader use of corporate offtakers.
- Third, the sector has attracted greater participation from a less specialized buyer base, which may be less focused on structural nuances, tax-exemption considerations, and long-term counterparty risk.
Together, these dynamics create conditions for a potential market correction. While the sector continues to offer attractive financing benefits to participating municipal utilities, we believe select transactions may increasingly test investor tolerance and the boundaries of tax-exemption, particularly where corporate participation and contractual complexity are more pronounced.
Mid-Year Outlook
Looking ahead, we expect credit differentiation to remain a defining feature of the municipal market. We continue to see value in municipals given current yield levels and broad credit quality. However, identifying areas that may generate above-market returns requires more detailed analysis than it did at the start of the year.
The municipal yield curve remains relatively steep, though it has flattened from more extreme levels. Credit spreads are generally tight, and certain sectors, including AMT bonds, have converged toward fair value. We continue to see value in high-quality bonds around the 20-year maturity range, given the nearly 100 basis points of incremental yield from 10- to 20-year municipals. At the same time, not all bonds are created equal. Coupon, call structure, maturity, and issuer fundamentals remain important to relative value.
We have also seen a stronger quality bias as lower investment-grade bonds have become less compensated in some parts of the market. In the five- to seven-year part of the curve, A-rated and BBB-rated bonds can still appear attractive relative to historical spread-curve pricing. The continued shift in the municipal buyer base, including demand from separately managed accounts, may also influence demand in that segment.
Conclusion
The second half of 2026 begins with a municipal market that still offers value, though with greater selectivity. Yield levels remain attractive, demand for tax-exempt income remains supportive, and issuance continues to create opportunities for active buyers. Yet the work has become more demanding. The curve has flattened, spreads are tighter, and several sectors require closer review of structure, policy exposure, and rating agency sensitivity.
In this environment, we believe municipal outcomes will be driven less by broad market exposure and more by security selection, call structure, credit discipline, and the ability to distinguish durable fundamentals from issuance volume alone.
ii Bureau of Labor Statistics
iii Bloomberg
iv Bloomberg
v Bureau of Economic Analysis
vi Federal Reserve
vii ICI Municipal Bond Long-Term Mutual Fund and ETFs Weekly Flows (1/1/2025-6/30/2025 and 1/1/2026-6/30/2026).
viii The AMPWP Municipal Bond Intermediate Duration National Composite comprises all discretionary, fee-paying municipal bond portfolios managed with AMPWP Municipal Bond Intermediate Duration Strategy Standard Restrictions, comprised of the following:
- Benchmark – Bloomberg 1-15 Yr. Municipal Index
- Minimum AUM $4.9MM
- Investment Objective – Total Return
- No limitation on the maturity of individual securities
- The portfolio will consist exclusively of securities carrying an investment grade rating at time of purchase from at least one Nationally Recognized Statistical Ratings Organization (NRSRO) recognized by AMPWP, or if unrated, securities determined to be of comparable quality by AMPWP
- The maximum aggregate exposure to a single obligor will be limited to 10% of the market value of the portfolio at time of purchase; U.S. Treasuries, U.S. Agencies, and pre-refunded securities are exempt from this restriction.
- No state limitations
- No sector limitations
x Florida Policy.org Amendment 3: Property Tax Ballot Language Summary & County Fiscal Impact (06.18.26)
xi Fitch: Florida Property Tax Amendment Could Weaken Local Government Credit Quality (06.12.26)
xii Bloomberg News: Florida Property Tax Cut Could Strain Local Credit, S&P (06.11.26)
xiii Fitch: Florida Property Tax Amendment Could Weaken Local Government Credit Quality (06.12.26)
xiv Bloomberg as of 06.17.26
xv AMPWP Fixed Income Sector Brief: The Gradual Then Sudden Rise of Municipal Gas & Electric Prepay Bonds (02.19.26) (Reference relates to the Funding Recipients; data was derived from Bloomberg)
xvi Series 2026E Official Statement | CUSIP 13013JJD9
Disclosure
A&M Private Wealth Partners, LLC (“AMPWP”) is an SEC-registered investment adviser. SEC registration does not imply a certain level of skill or training. For additional information on the services AMPWP provides, as well as our fees for such services, please review our Form ADV at adviserinfo.sec.gov, contact us at 300 Banyan Boulevard, 10th Floor, West Palm Beach, FL 33401, or call us at (561) 268-0900.
This piece and its content reflect AMPWP’s views at the time of its writing, and the information presented and AMPWP’s views are for informational purposes only. Such views are subject to change at any time without notice including due to changes in market or economic conditions, and forward-looking statements or forecasts are based on assumptions and may not be realized. Future events and outcomes are inherently uncertain. Statements are subject to risks and uncertainties that could cause actual outcomes to differ. AMPWP has obtained information provided herein from various third-party sources believed to be reliable, however, such information is not guaranteed and is subject to errors, omissions, and changes. No reliance should be placed on the views and information presented when making any investment or liquidation decision. AMPWP is not responsible for the consequences of any decisions or actions taken or not taken as a result of the views and information presented, and AMPWP does not warrant or guarantee the accuracy or completeness of this piece or information presented.
Additional content may be relevant for further context or other insight. Portfolios should also be viewed in the context of the broad market and general economic conditions prevailing during the periods covered by performance and other information. Any references to future returns and/or risk are not promises of the actual return a portfolio may achieve nor do they reflect all risks. Not all investments are suitable for all investors. All investments involve risk of loss, including to principal, and all investors must be prepared to bear such loss. Different securities, strategies, and allocations have different costs and risks, and diversification also does not assure a profit nor protect against a loss. Past performance is not a guarantee of future results. Additionally, changes in investment strategies, contributions, or withdrawals may materially alter results, as may market conditions, other factors including but not limited to economic factors, fees, expenses, and events. Nothing herein should be construed as an investment recommendation. AMPWP does not provide legal, accounting, or tax advice, and AMPWP’s services are not intended to act as a substitute for such advice. AMPWP encourages you to seek the counsel of a qualified attorney and/or accountant for legal, accounting, or tax advice.