

The first quarter of 2026 marked a decisive transition from the optimism of late 2025 to a more complex and fragile macro regime driven by geopolitical upheaval. Markets began the year by extending the prior cycle’s narrative of resilient growth, moderating inflation, and broadening participation, despite elevated valuations. By quarter-end, that equilibrium had broken. An abrupt escalation in geopolitical risk in the Middle East triggered a violent energy-price shock and a rapid tightening of financial conditions, fundamentally altering the outlook for inflation, monetary policy, and risk assets. Looking toward Q2, investors face a landscape defined less by business-cycle dynamics and more by geopolitical outcomes, energy supply constraints, and the credibility of policy responses.
Q1 2026 Market Snapshot: Returns Masking Rising Fragility
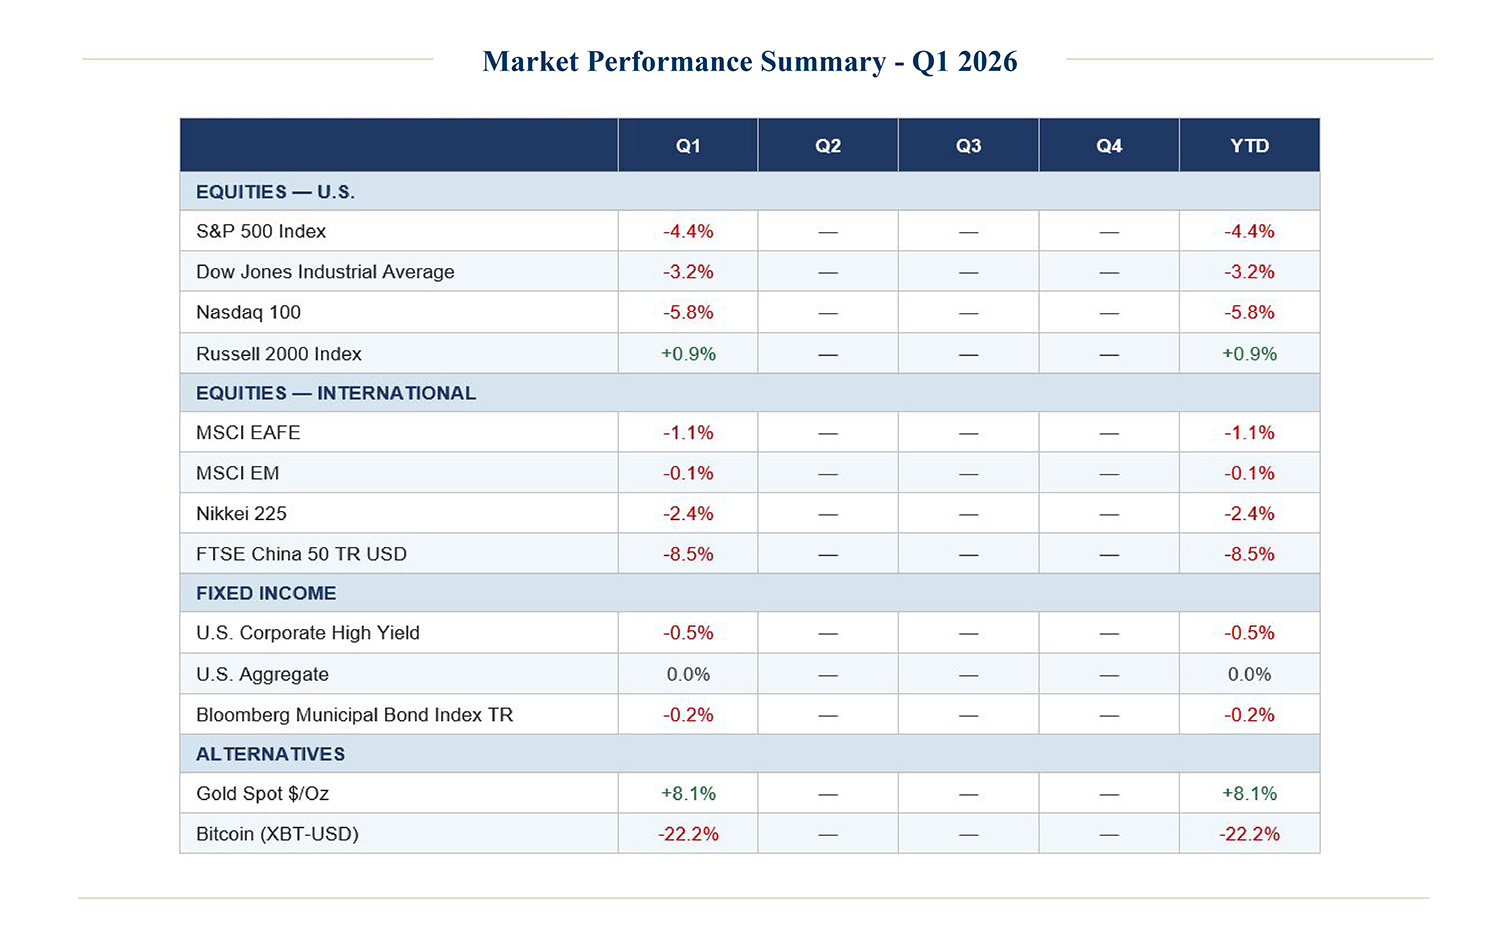
At the index level, Q1 market performance understated the degree of underlying stress that built as the quarter progressed. A rotation favoring cyclicals and small-cap stocks gave way to sharp dispersion across sectors and asset classes as energy prices surged and financial conditions tightened.
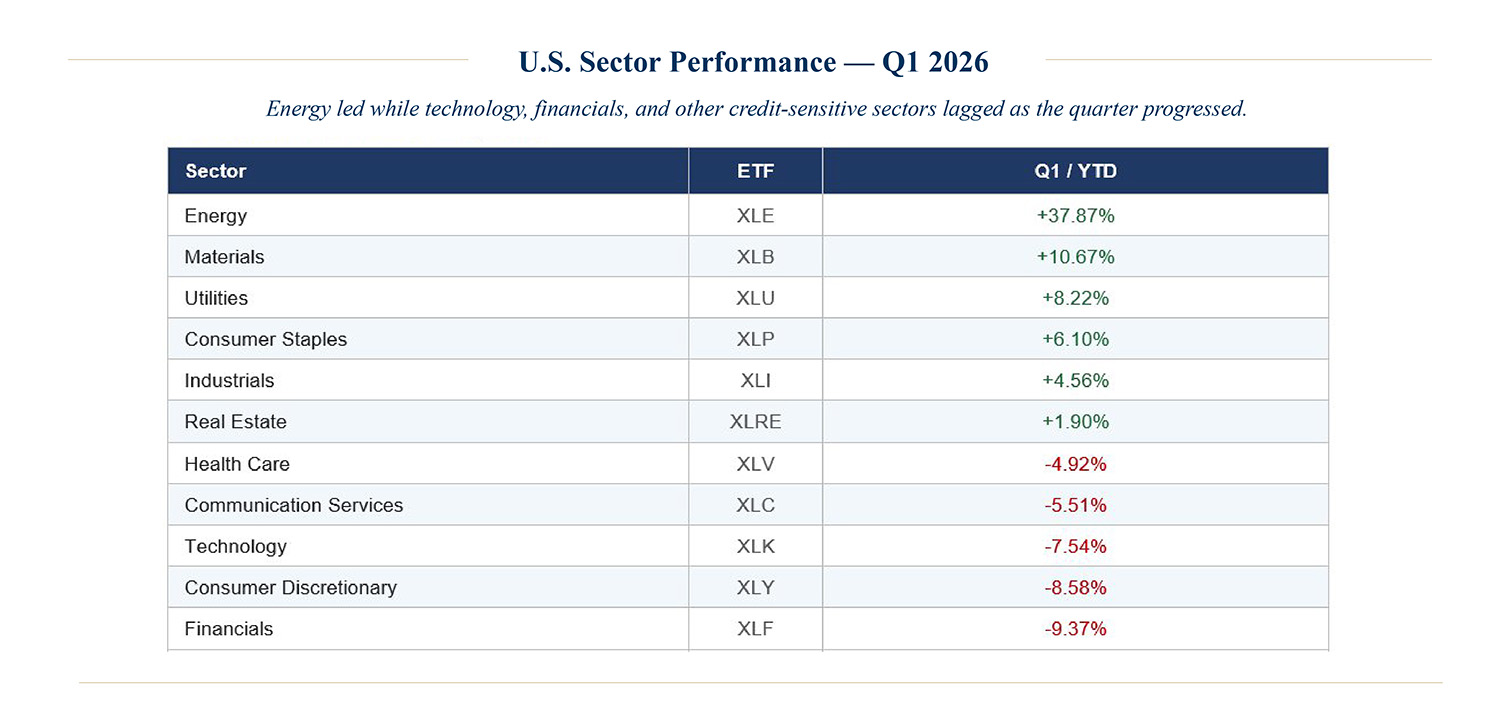
Energy-related assets were clear outliers, reflecting both direct exposure to higher commodity prices and renewed investor demand for inflation hedges. In contrast, growth-oriented equities, financials, and credit-sensitive assets posted pronounced drawdowns as volatility rose and rate expectations shifted. Fixed-income returns, as a group, were flat, with a distinct bifurcation across credit quality as spreads widened.
The Macro Backdrop: From Disinflation Confidence to Inflation Shock
Inflation and Monetary Policy: A Narrative Reversal
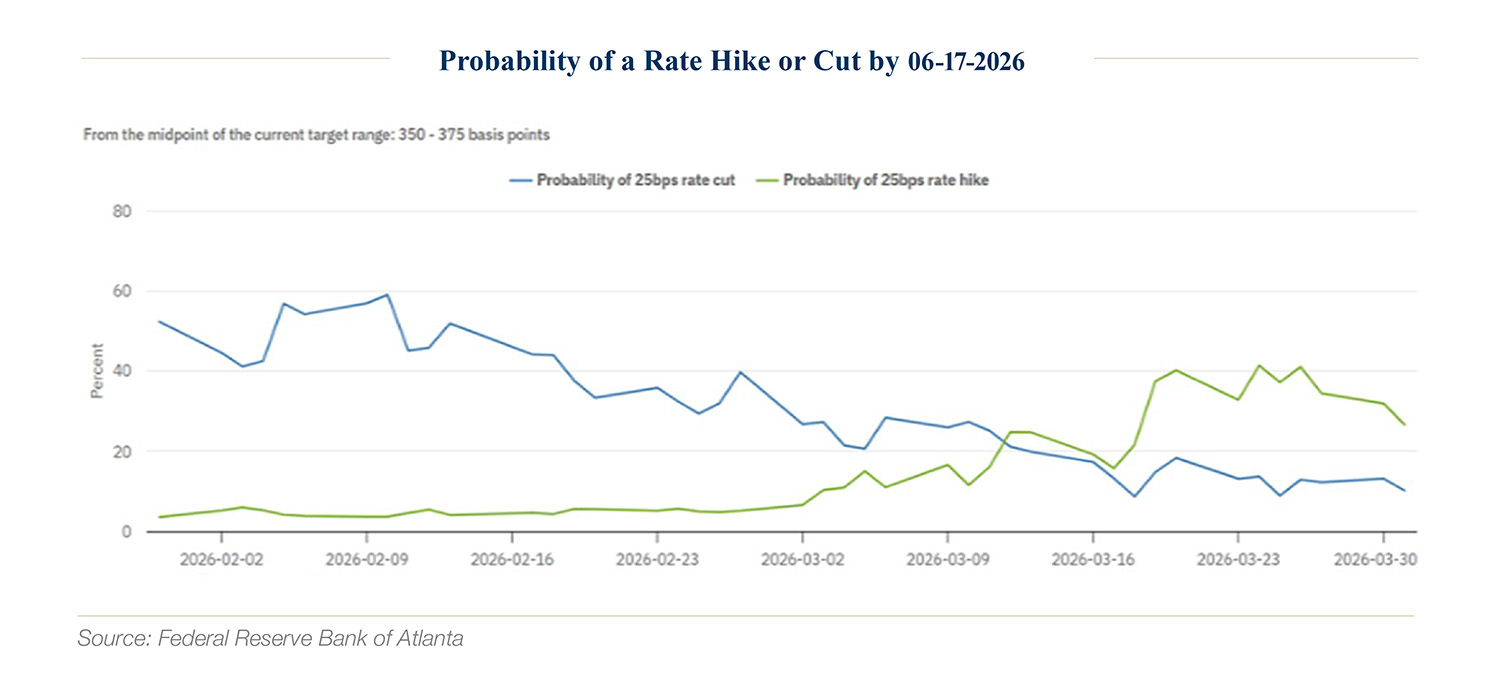
Consumer price growth entered the year on a durable downward path, supported by goods disinflation, easing shelter pressures, and moderating wage growth. This reinforced the widespread belief that the Federal Reserve would continue easing. Through January and early February, futures priced in multiple rate cuts over the next twelve months, reflecting this confidence.
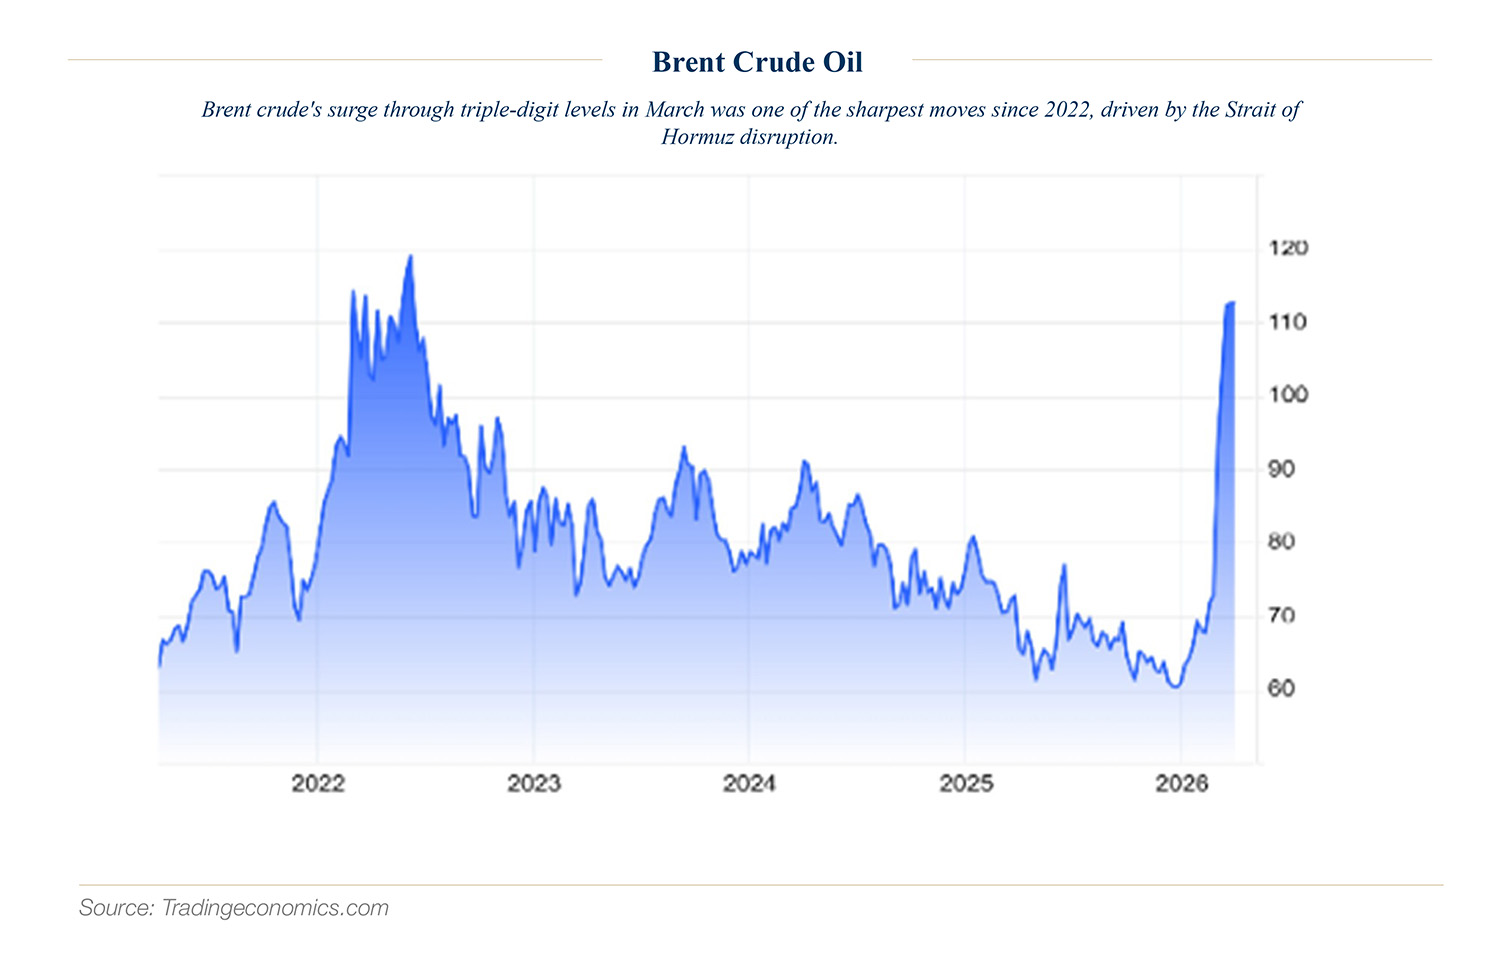
Escalating tensions between the U.S. and Iran, however, which disrupted shipping lanes in the Strait of Hormuz and catalyzed the strongest surge in oil prices since 2022, quickly shattered that outlook. In late February, Brent crude rose from the $70s in late February into triple-digit territory in a matter of weeks. Inflation expectations responded immediately, reversing months of improvement. Central banks, including the Fed, shifted their growth-oriented tone toward inflation vigilance, introducing renewed uncertainty around the policy path for the remainder of 2026.
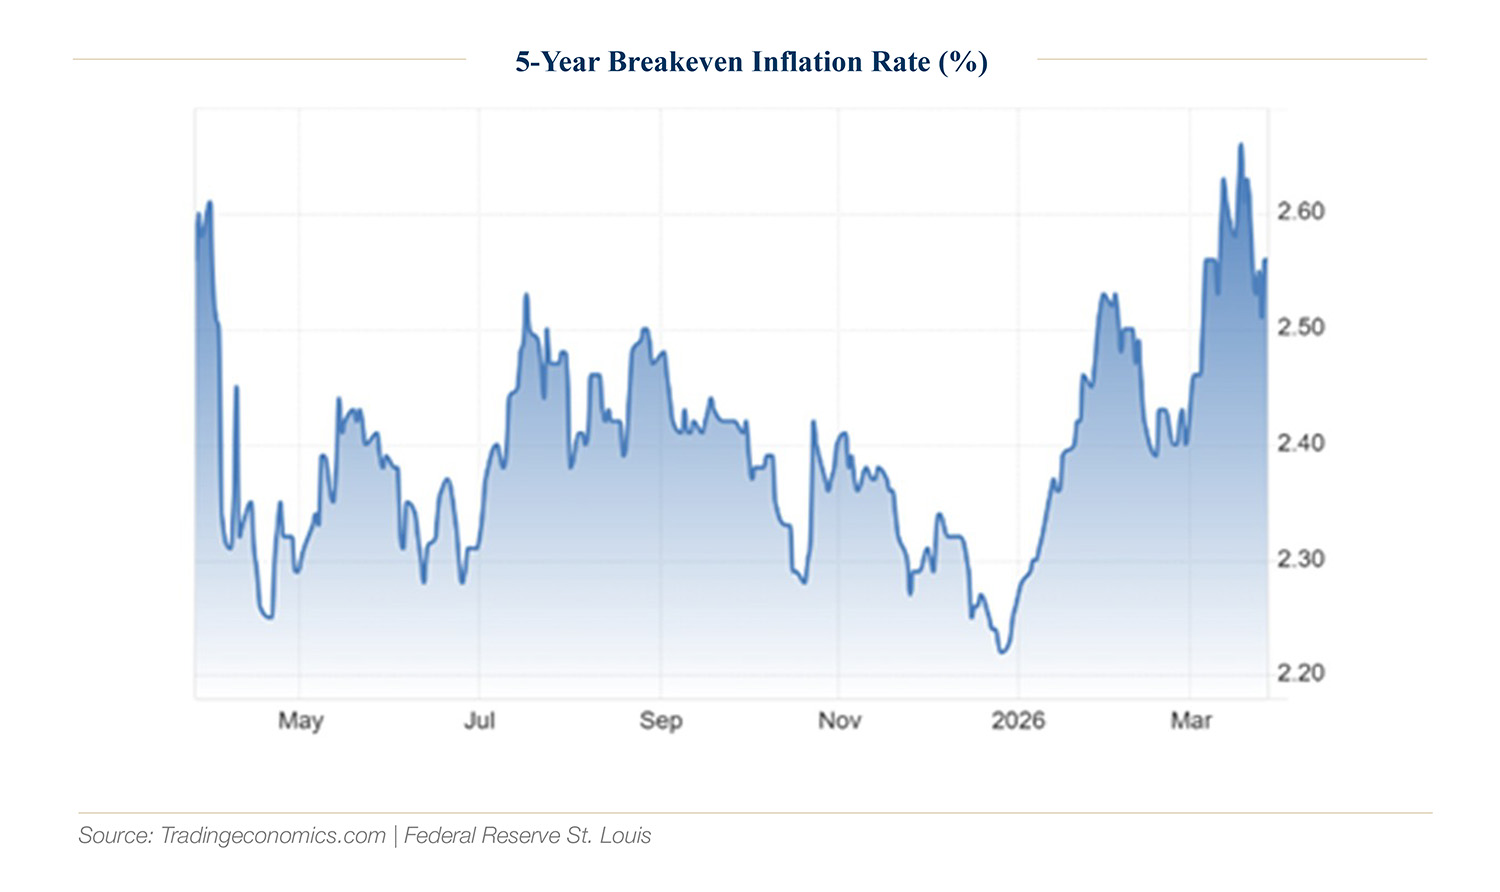
Breakeven inflation reversed months of improvement as energy prices soared, complicating the Fed’s easing calculus. As a result, the policy narrative reversed across the quarter as inflation expectations rose and rate-cut expectations unwound.
A close historical parallel to March’s sequence of events is the 1978–79 Iranian Revolution. Direct U.S. and allied involvement spurred political destabilization, deliberate disruption of oil infrastructure, and an unprecedented declaration of a chokepoint that amplified panic-buying well beyond what supply fundamentals alone would justify. In 1979, oil prices more than doubled in twelve months, as global oil supply fell 4% while fear-premiums compounded genuine scarcity.
The critical distinction today is Iran’s diminished supply role, the United States’ lack of reliance on foreign oil, and the global economy’s substantially lower energy intensity per unit of GDP. In 1978, Iran produced approximately 5.7M barrels per day, or 10% of global supply at that time. Today, that figure is approximately 3M barrels per day, or about 3% of global production, roughly 70% smaller. A complete halt to Iranian output would thus remove far less from global markets today than the Revolution did. Moreover, today, U.S. shale, Saudi Arabia, and the IEA’s strategic reserves stand ready to buffer the impact. The 1978 framework is a useful behavioral and structural guide for this conflict, but that period’s oil price arithmetic overstates the supply shock.
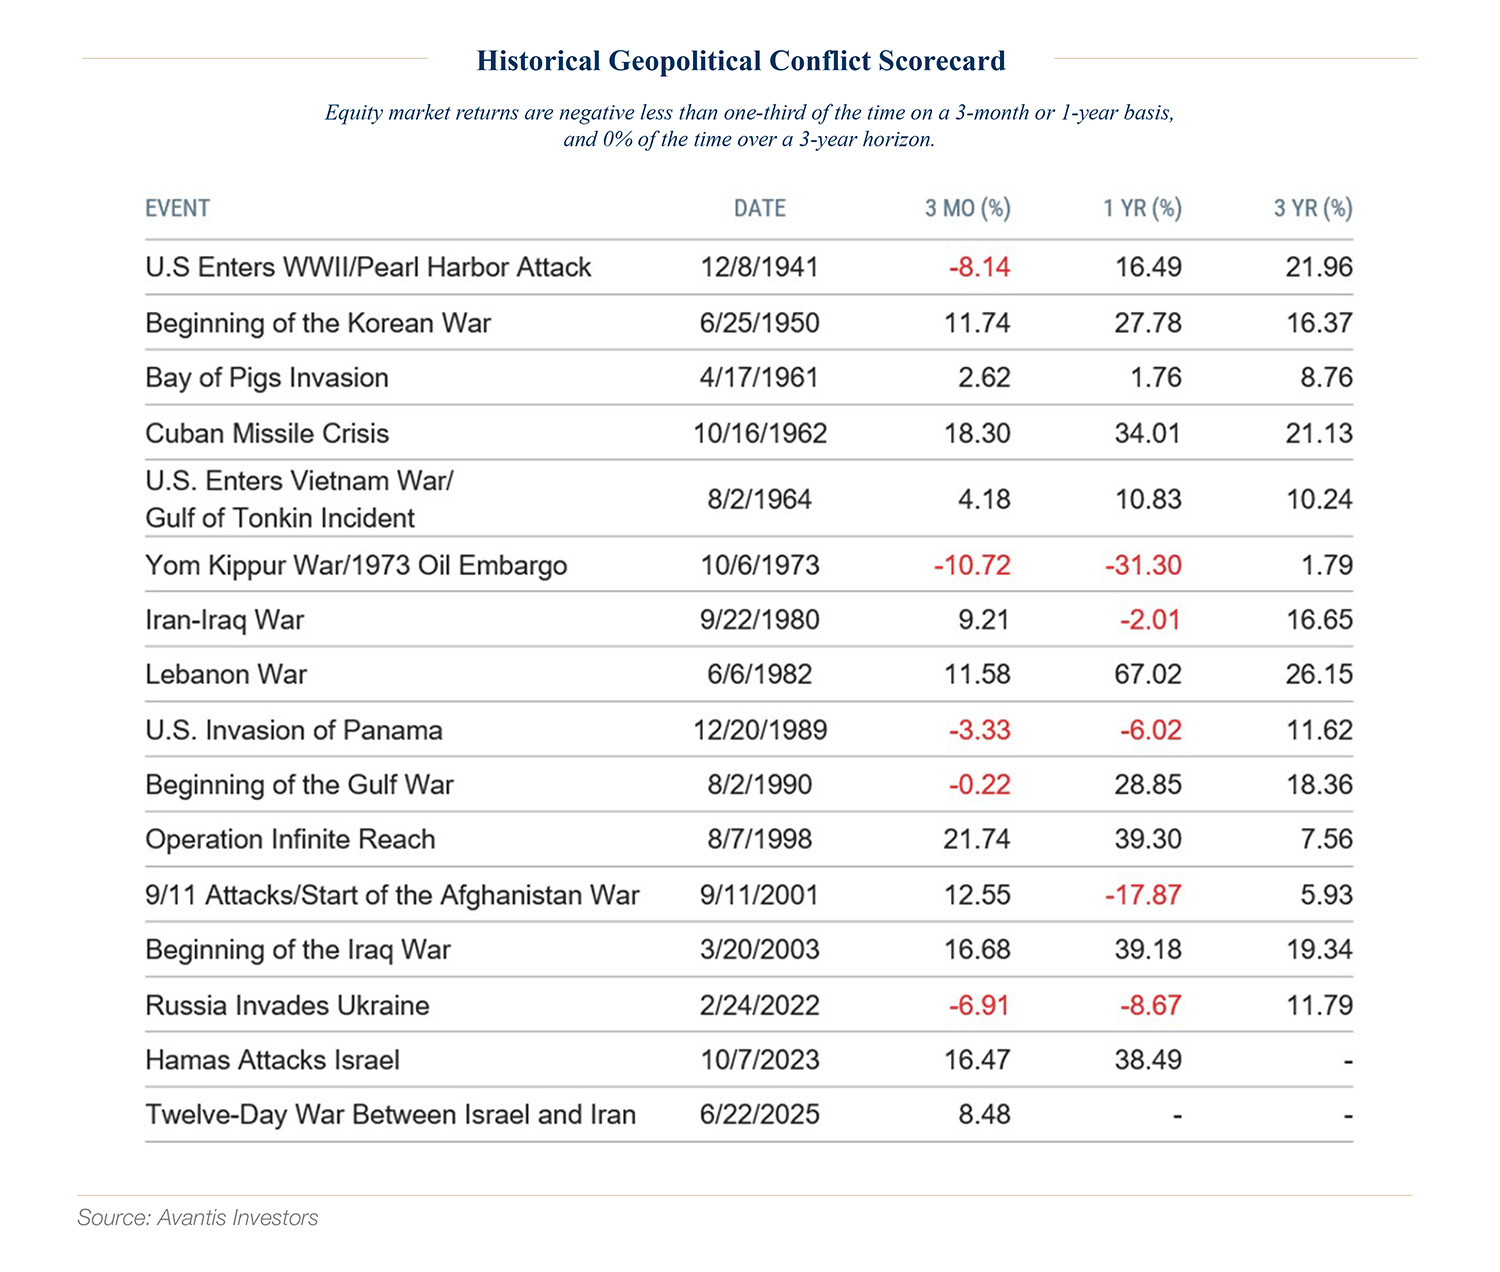
An analysis of market returns following major geopolitical events shows that equity markets are negative on a 3-month or one-year basis just over 30% of the time following similar geopolitical shocks (see table below), and 0% of the time over a 3-year horizon. The data reinforce a consistent lesson for building long-term wealth: Investors who remain disciplined fare better than those who reposition defensively.
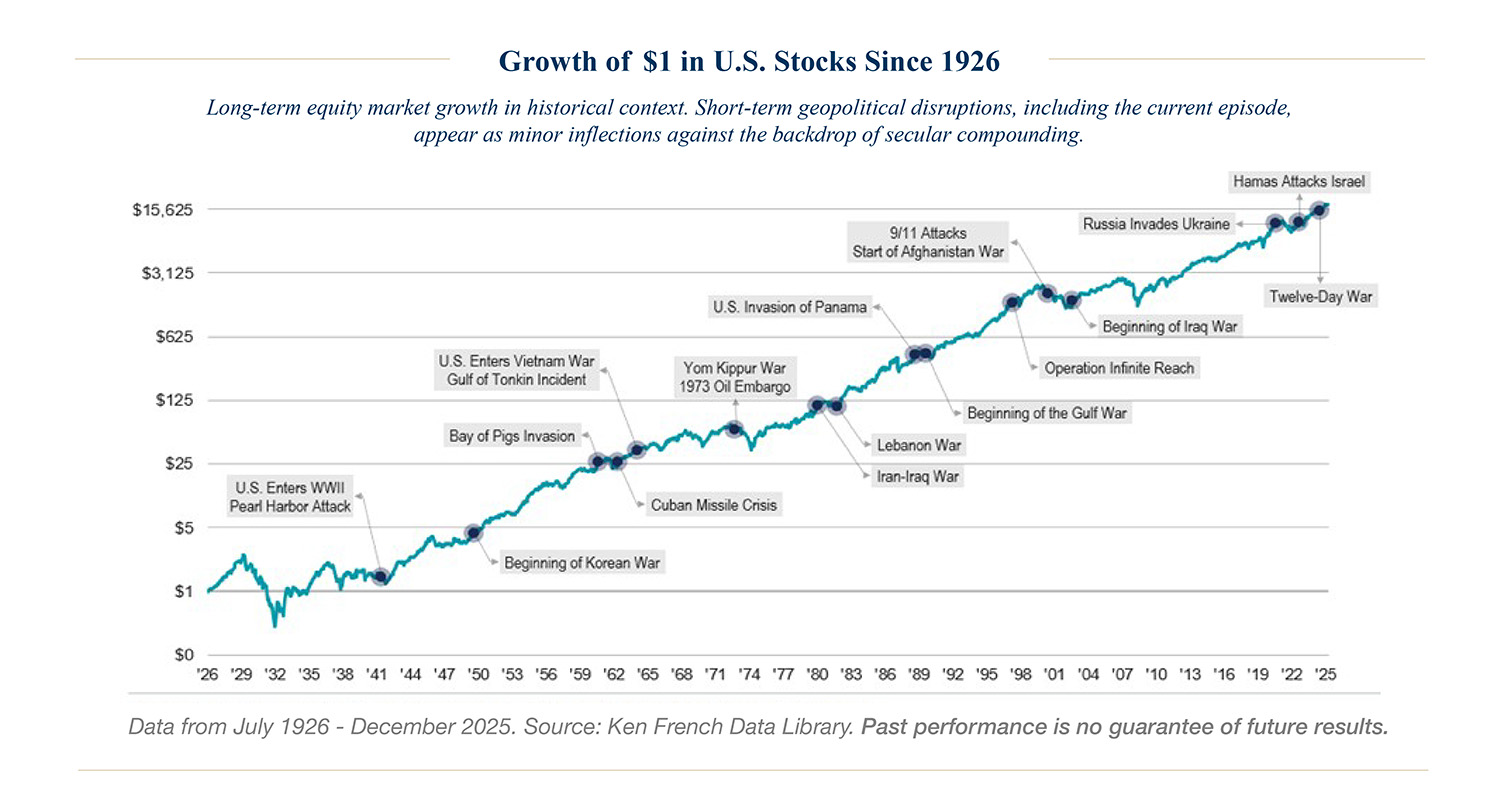
The illustration below of long-term growth provides further perspective. Short-term market volatility around geopolitical events, including episodes far more severe than the present, appears remarkably inconsequential in the context of a fuller historical view. We believe the current disruption will prove equally unremarkable. This perspective is central to why time in the market consistently proves more valuable than timing the market, and why the front-end of our investment process focuses on identifying which dollars can be structurally committed to equities for the long term.
Growth and Labor: Cooling Beneath the Surface
Even before the energy shock, signs of moderation were emerging. Labor markets remained resilient in headline terms, but underlying indicators pointed to cooling momentum. Job openings declined, hiring intentions softened, and wage growth continued to decelerate. Housing activity remained constrained by affordability and supply challenges despite modest declines in mortgage rates.
These trends did not signal imminent recession, but they did suggest a narrowing buffer against external shocks. By March, the combination of higher energy prices and tighter financial conditions materially widened downside risks to growth, particularly for interest-sensitive and lower-margin segments of the economy.
Market Performance: Rotation, Fracture, and Regime Break
The quarter opened with equity markets extending the themes that defined late 2025, as leadership continued rotating toward small caps, cyclicals, and value-oriented sectors. Industrials, materials, energy, and consumer discretionary stocks advanced on optimism about domestic growth and a soft landing. Commodities provided early warning signals: Gold rallied on geopolitical uncertainty and residual inflation hedging, while crude oil rebounded on supply concerns tied to Venezuela and rising Middle East tensions. These moves foreshadowed the forces that would come to define the quarter.
As the quarter progressed, the surface strength of earnings gave way to structural anxiety. S&P 500 earnings growth for Q4 2025 exceeded 13%, marking a fifth consecutive quarter of double-digit expansion, yet equity performance became increasingly fragile. The AI investment narrative began to fracture as weak guidance from select semiconductor and software companies reignited concerns around capital intensity and the timing of returns on massive AI-related spending. Policy volatility compounded the uncertainty, as a Supreme Court tariff ruling, followed almost immediately by the announcement of a new global tariff regime, left markets unable to establish a footing as sharp rallies gave way to equally sharp reversals.
The equity drawdown pattern is consistent with the template provided by the 1978–79 episode. That produced a decline of roughly 14% over approximately 55 days, followed by a recovery that unfolded over the subsequent nine months. History suggests that investors who repositioned defensively following the initial shock surrendered returns they did not need to.
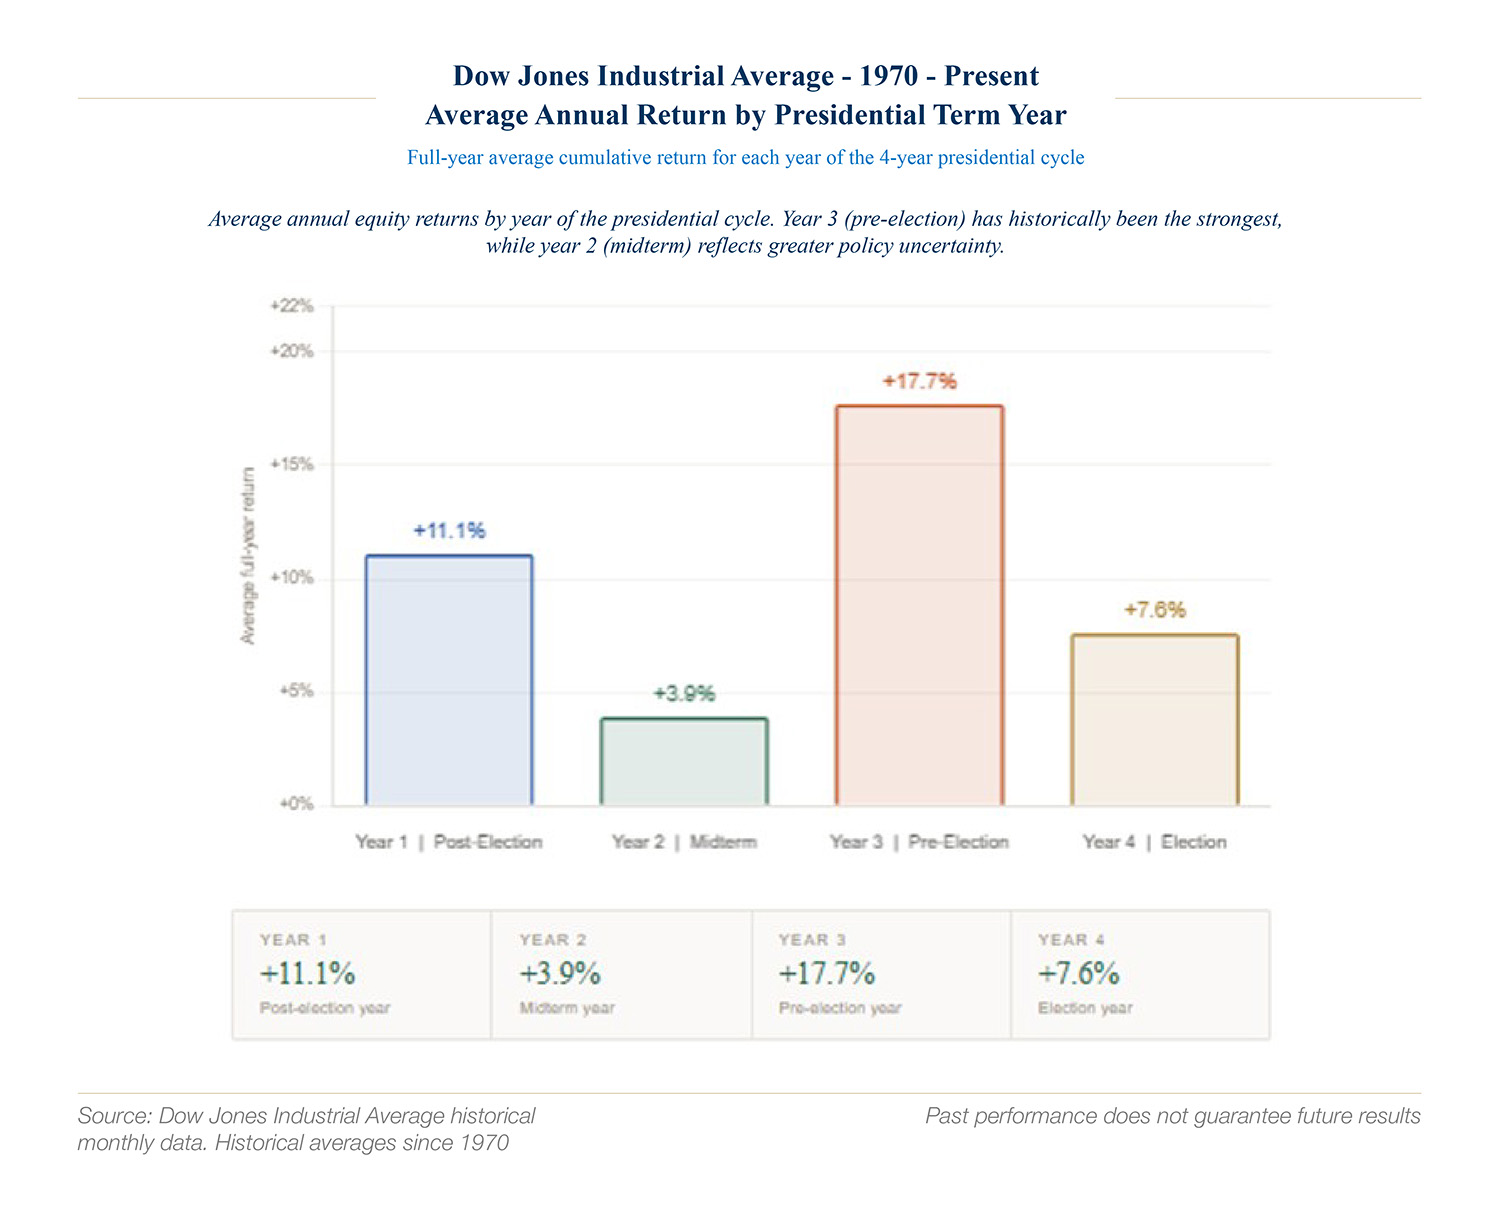
Adding a further layer of cyclical context, 2026 is a midterm election year, which historically coincides with more subdued equity market returns relative to the broader presidential cycle. Yet this characterization requires nuance. Most midterm years still produce positive absolute returns, and the headline pattern obscures meaningful variation by government composition. The distinction between unified and divided government during midterm years, for example (see chart), produces different policy and market dynamics, though the limited sample size of such conditional analyses warrants caution in drawing firm conclusions.
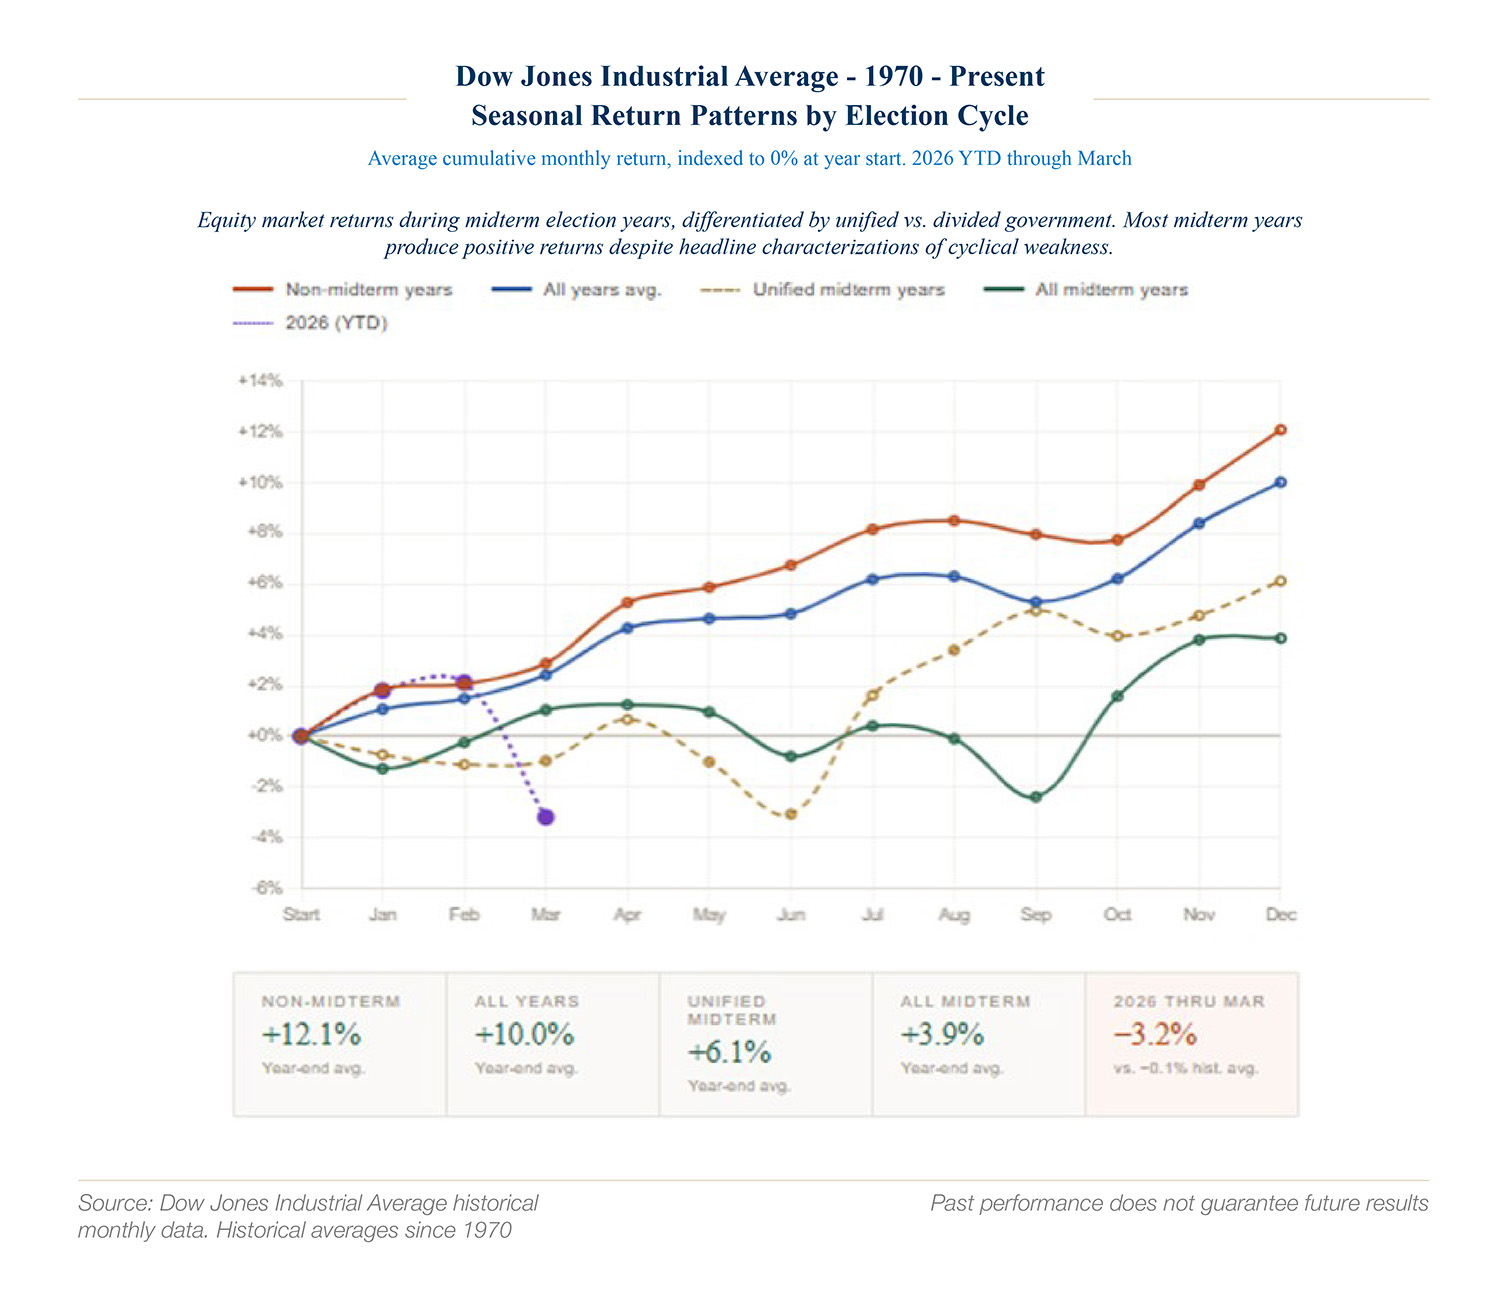
Whereas policy gridlock and uncertainty plague election years, stimulative policy agendas tend to bolster markets in the years prior to elections as incumbents begin campaigning for votes. Whether framed as a post-midterm rally or a third-year tailwind, the underlying dynamic is consistent. The chart below illustrates average annual returns across the four-year presidential cycle, providing a useful complement to the geopolitical and macro analysis above.
Earnings Strength Versus Macro Deterioration
History suggests that earnings revisions tend to lag inflection points in financial conditions. As volatility rises, credit spreads widen, and input costs increase, equity valuations typically adjust first. Q1 followed this pattern. Multiple compression, rather than immediate earnings downgrades, drove much of the market’s repricing, underscoring the vulnerability inherent in elevated starting valuations.
Valuation Compression: From Peak to Reset
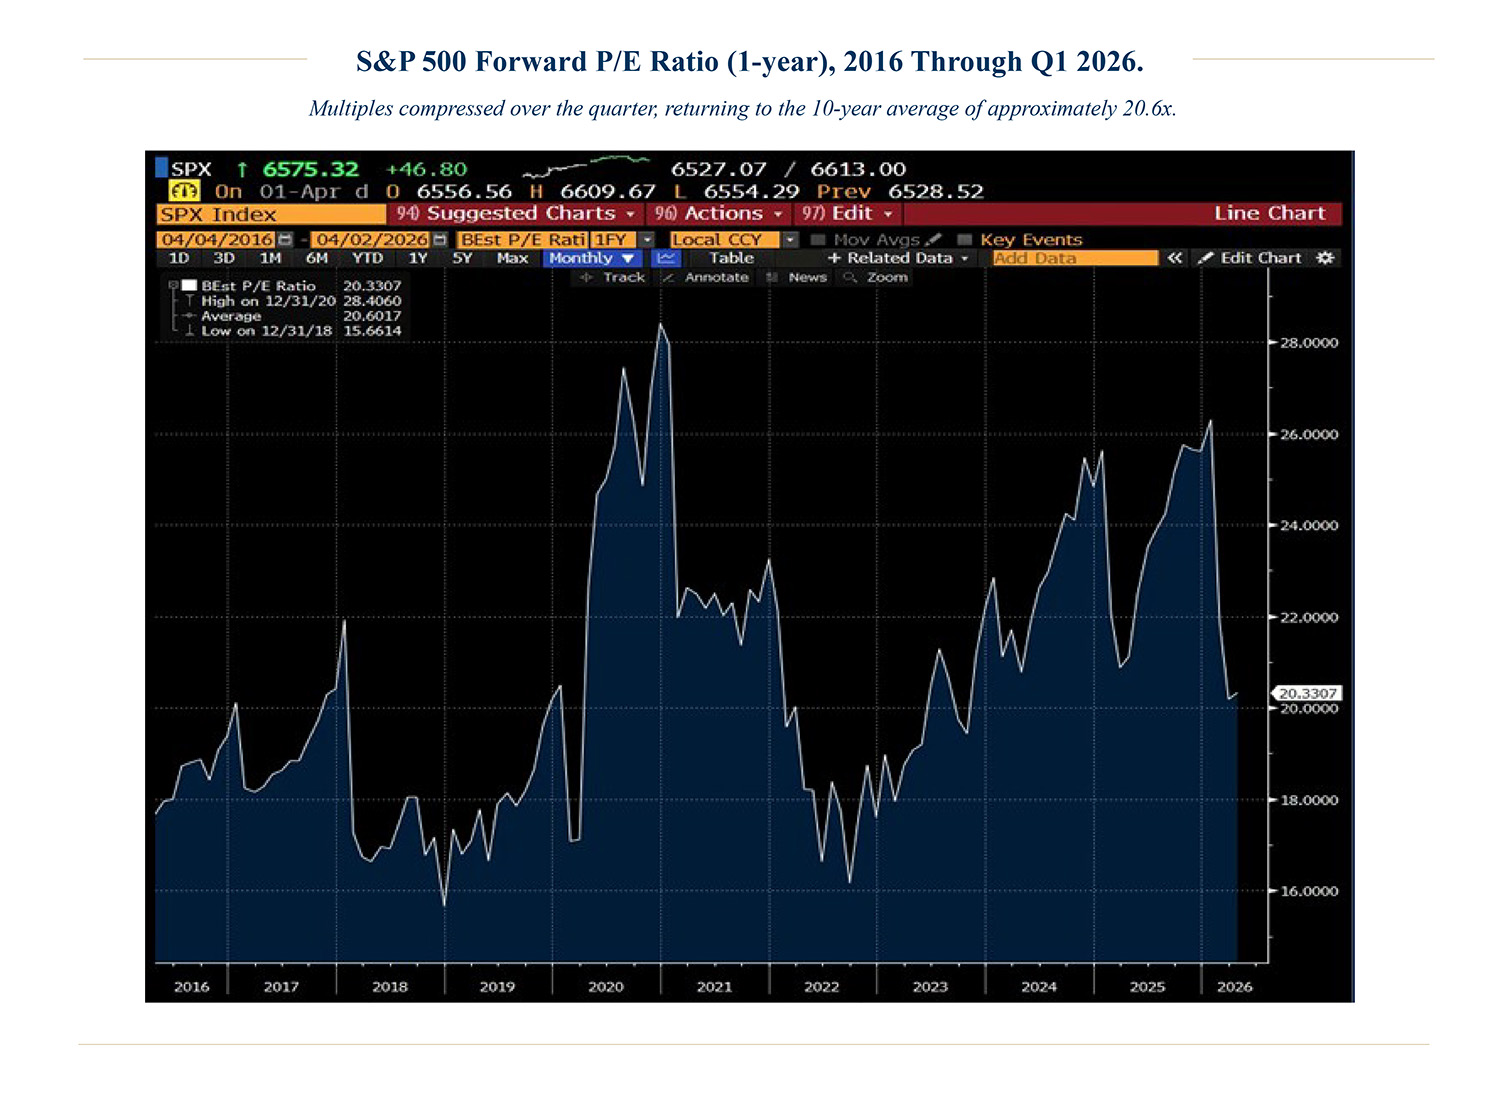
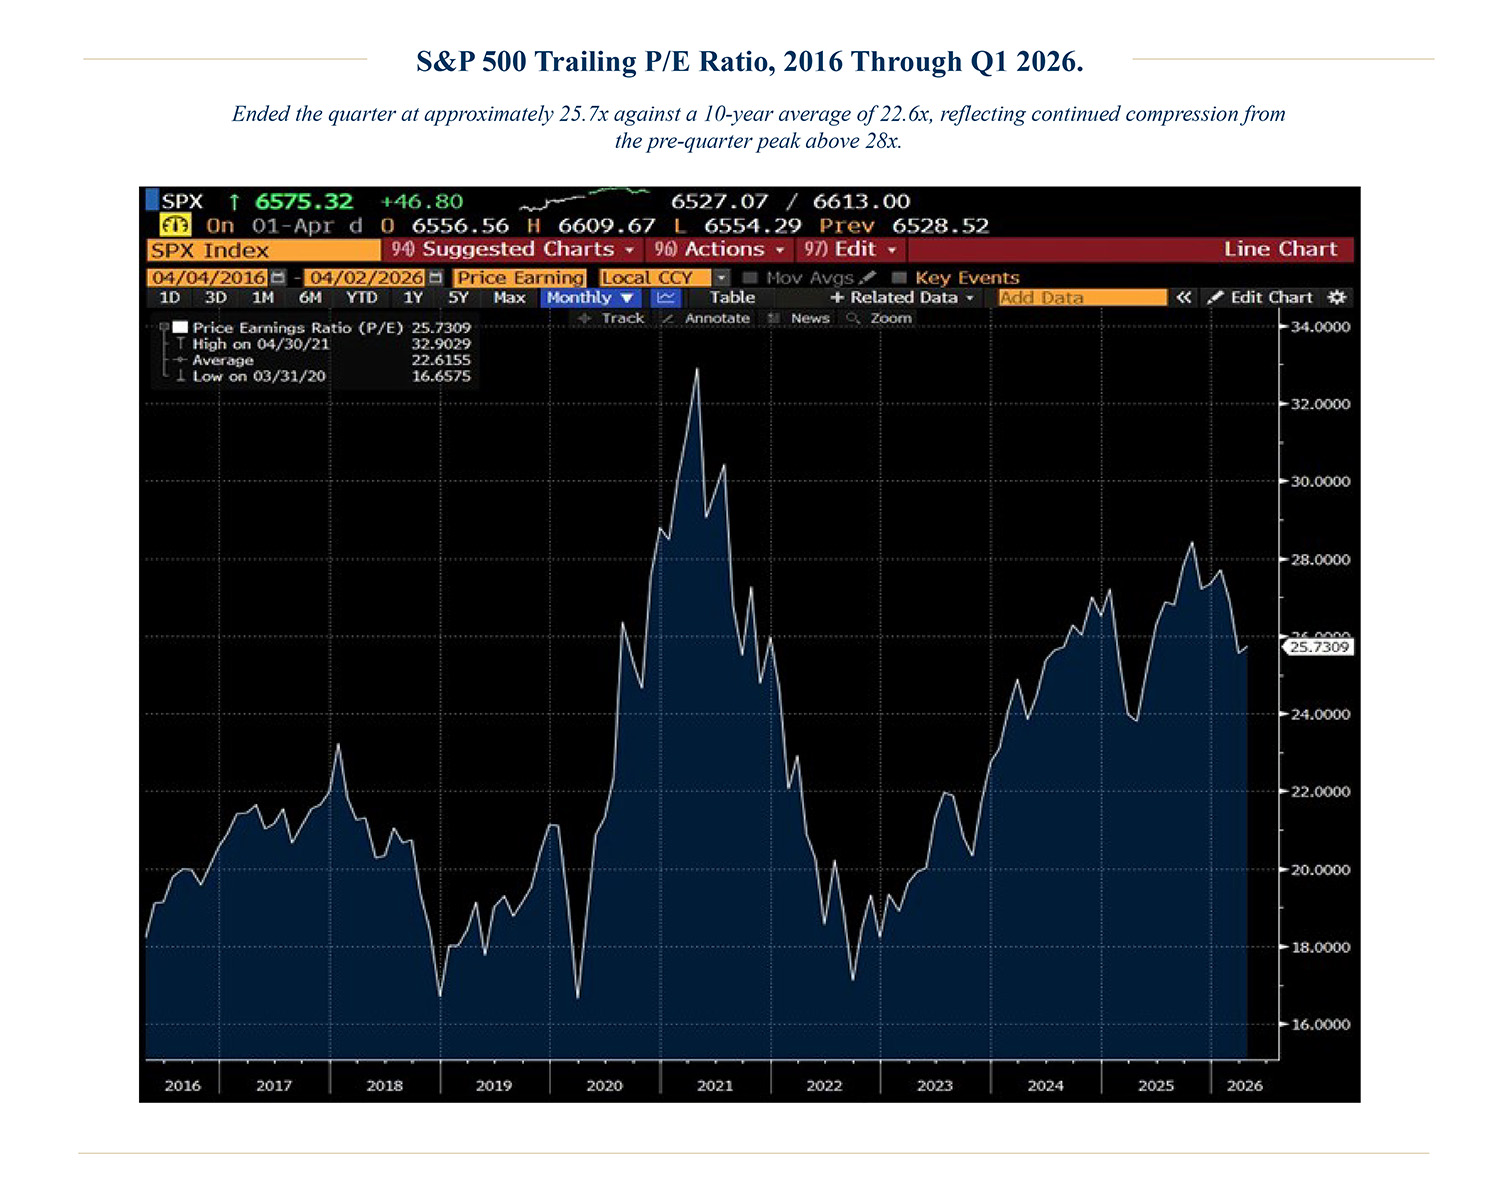
One of the defining features of Q1 was a significant and rapid compression in equity valuations. The S&P 500 entered the year trading at a trailing price-to-earnings (P/E) ratio of approximately 28x and an estimated forward P/E of 23x, both meaningfully above long-run averages and among the highest levels observed outside the post-COVID surge. By quarter-end, multiple compression had brought the trailing P/E to approximately 25.7x and the forward P/E to approximately 20.3x, the latter close to its decade-long average of around 20.6x.
The speed of that compression matters as much as the magnitude. Forward multiples fell several turns in a single quarter, which historically occurs when either earnings expectations collapse or required returns rise sharply. In Q1, the latter predominated. Earnings estimates held firm; what changed was the discount rate embedded in valuations, as inflation expectations moved, rate-cut expectations unwound, and geopolitical risk premia expanded. The market did not conclude that businesses became less profitable; it concluded that those earnings were worth less in an environment of higher and more uncertain rates.
The forward P/E landing at the 10-year average is, in isolation, a constructive signal suggesting that the most acute phase of valuation risk may have passed. But comfort is conditional, and consensus earnings estimates for 2026 have not yet fully incorporated the input-cost and demand implications of a sustained energy shock or the margin effects of tighter financial conditions. Should revisions push estimates lower in the coming quarters, adjusted multiples could still prove optimistic in retrospect. This is the residual valuation risk we continue to monitor as Q2 unfolds.
Dashboard Evidence: A Regime Shift in Real Time
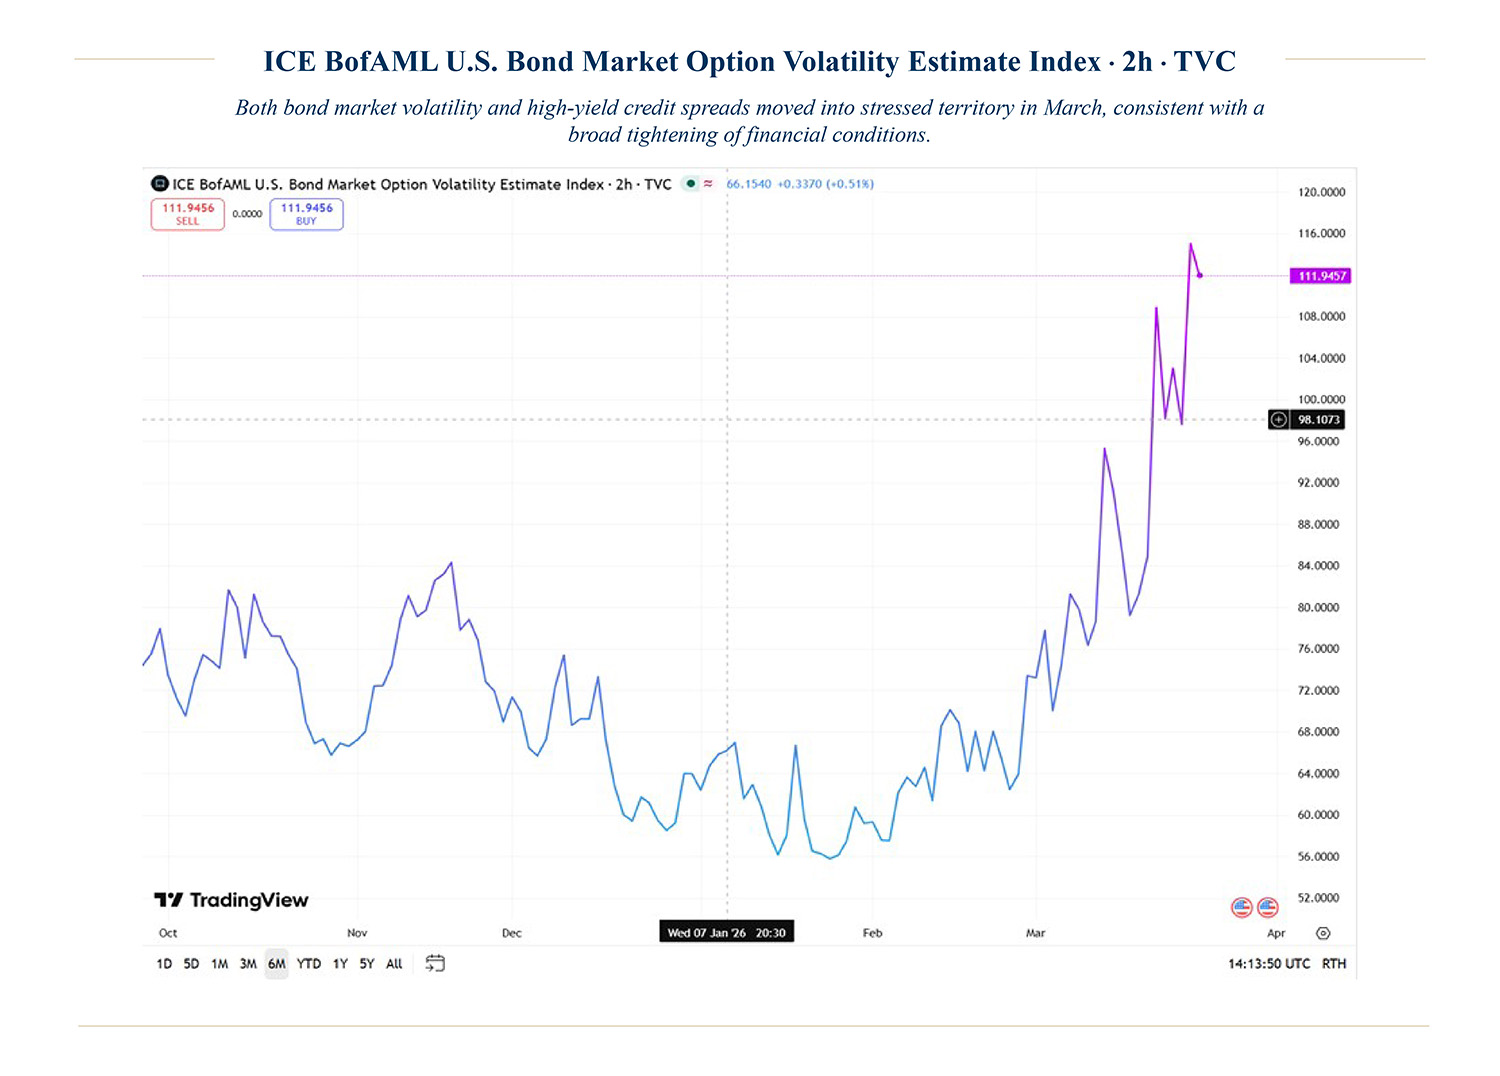
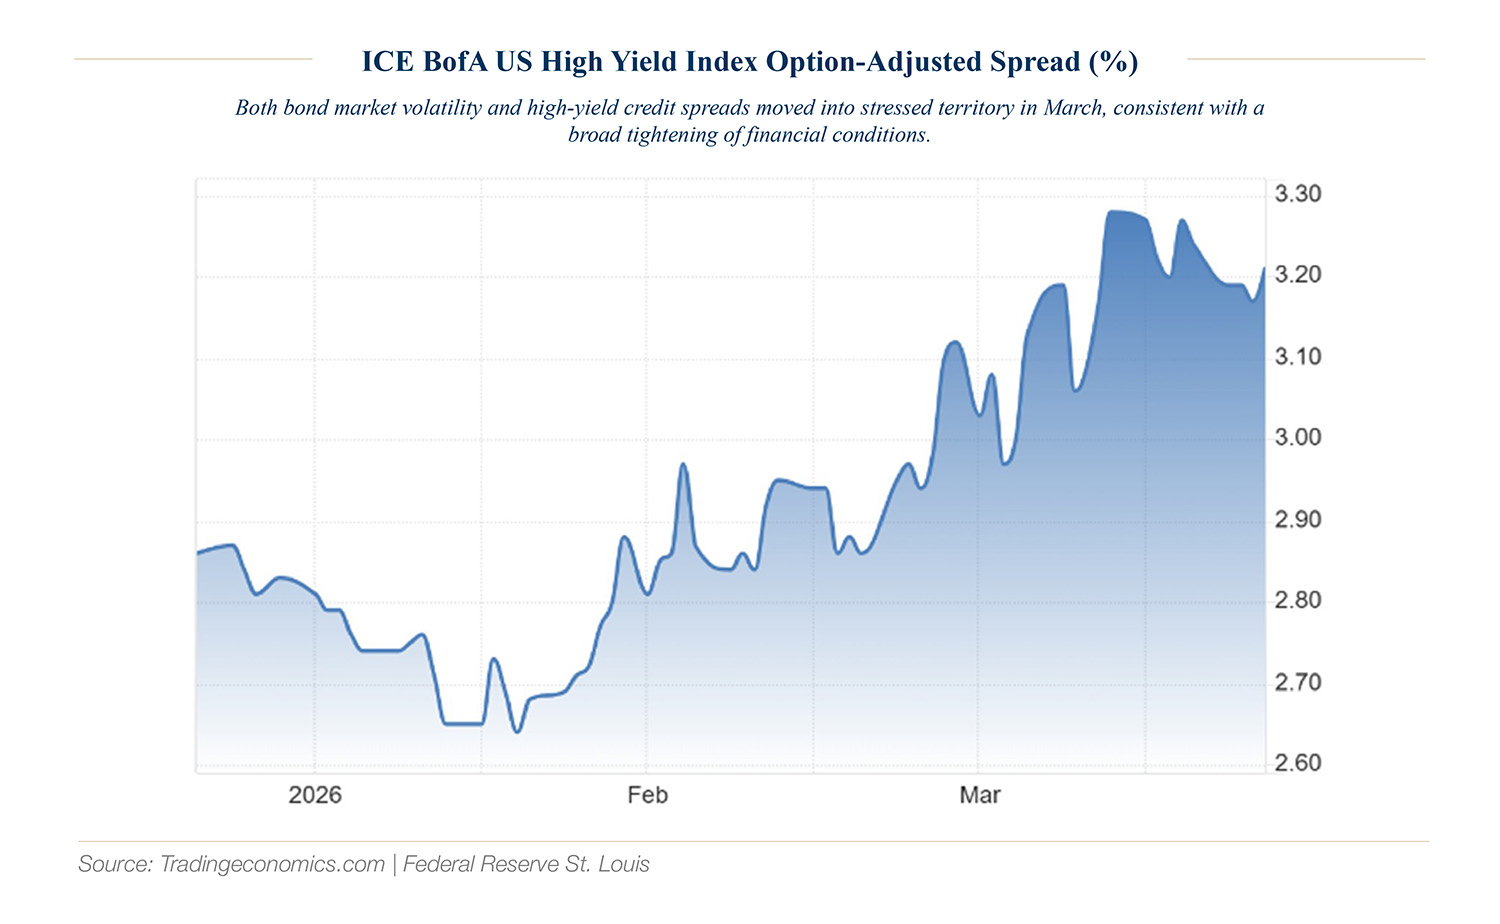
AMPWP’s internal dashboards captured this transition from optimism to fragility with unusual clarity. Valuations, already elevated at the start of the year, became increasingly problematic as yields and volatility rose. Risk indicators cratered, with both equity and fixed-income volatility moving into historically stressed regimes. Credit spreads widened from complacent levels, signaling tightening financial conditions that extended beyond public markets.
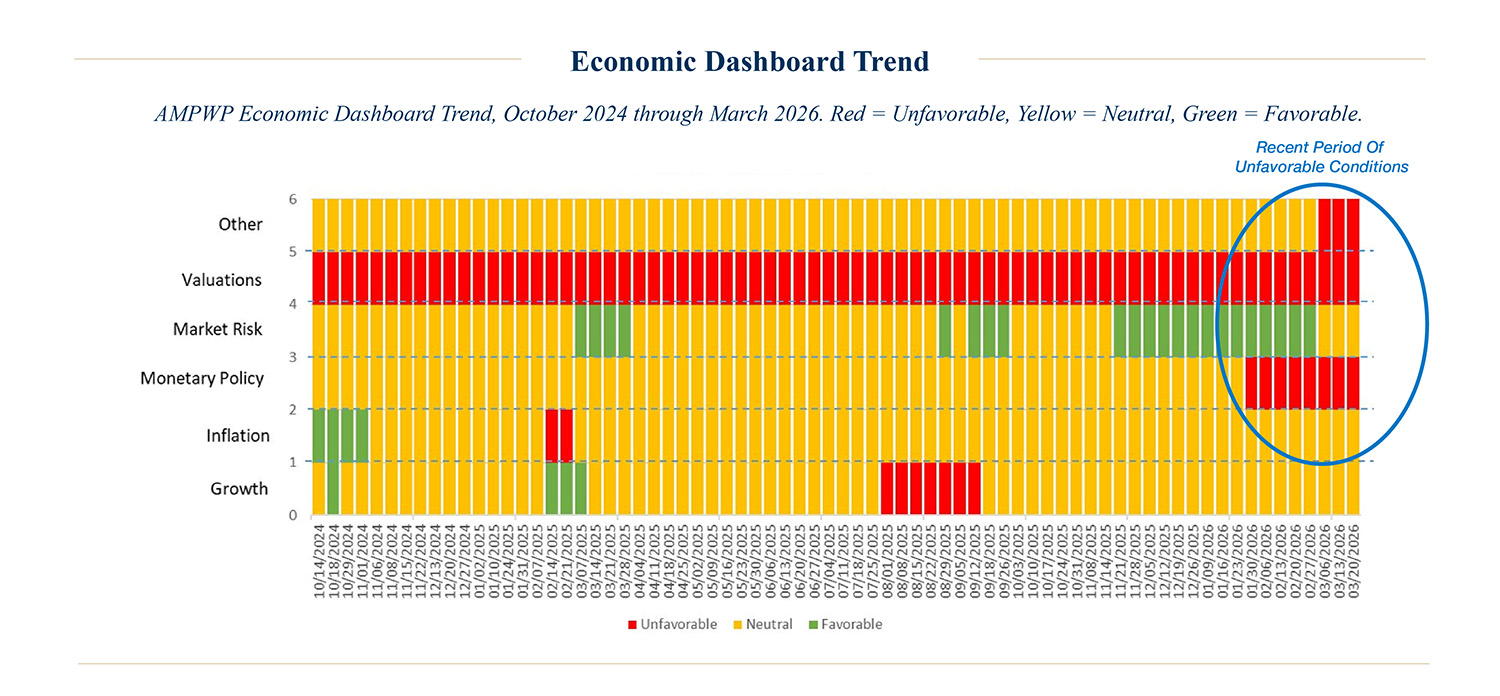
Importantly, this was not merely a sentiment-driven pullback. The spike in energy prices has direct implications for inflation, margins, and policy, justifying a rapid repricing of risk and exposing the vulnerability embedded in lofty starting valuations.
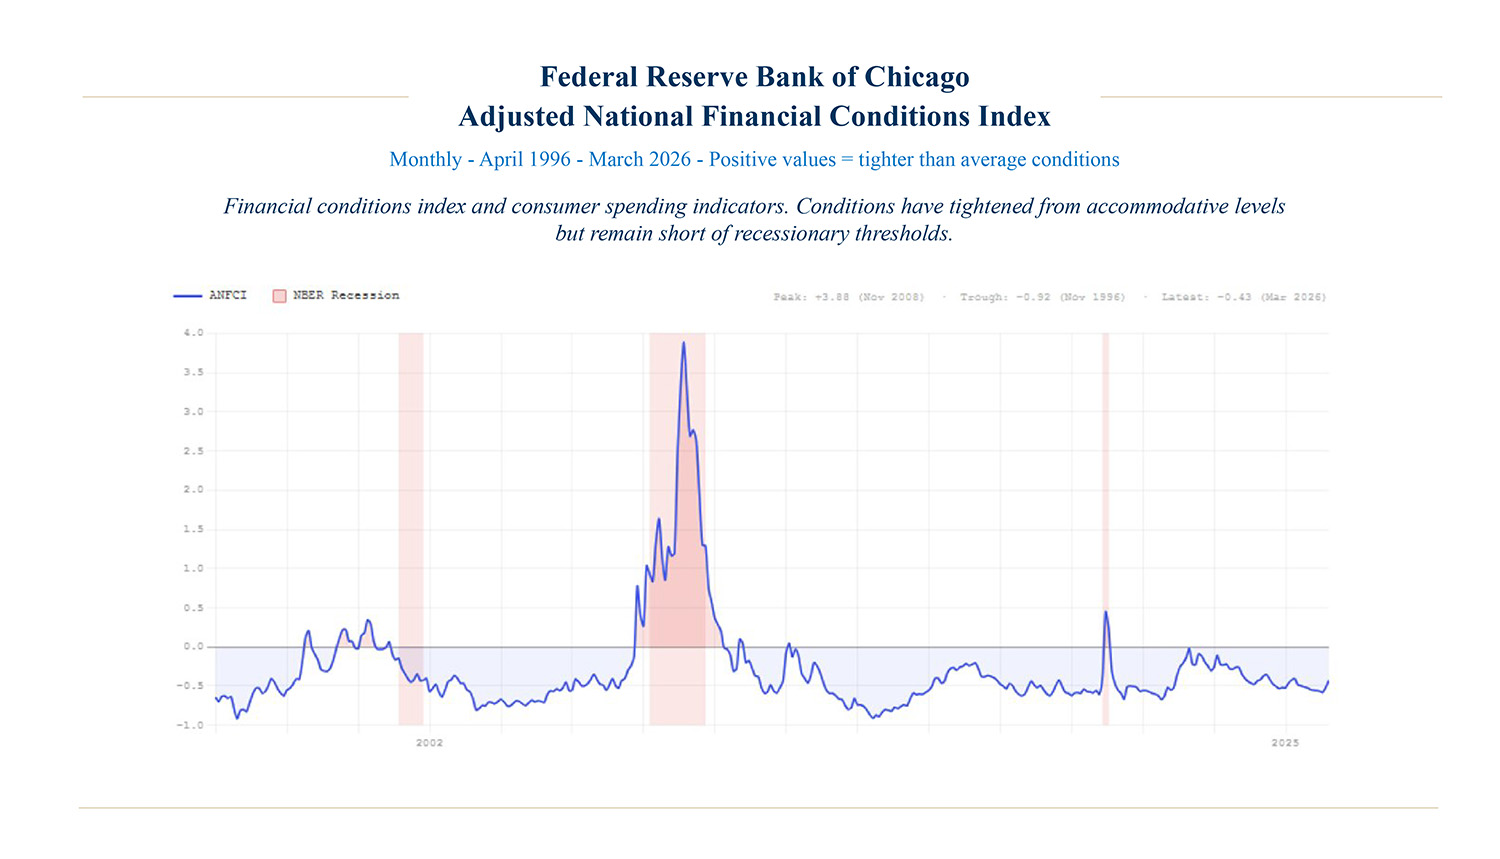
Resilient consumer spending has long been a defining feature of U.S. economic strength, and recent retail sales data have broadly held up. However, the household sector is absorbing meaningful headwinds: Gasoline prices have risen to over $4 per gallon from approximately $2.80 prior to the conflict, and modestly higher mortgage rates are adding to affordability pressure. Business owners, meanwhile, contend with lower equity valuations, wider credit spreads, and a less accommodative Fed. In aggregate, these dynamics represent a tightening of financial conditions – not yet at levels that would make a recession the base case, but moving in an adverse direction, as illustrated below.
Quality, Factor Performance, and Cross-Asset Observations
A distinctive characteristic of our active equity approach is a consistent focus on quality: companies that exhibit higher returns on equity, disciplined balance-sheet management with lower leverage, and a demonstrated record of earnings growth across market cycles. This is not a tactical tilt calibrated to short-term conditions; it is a core principle of how we construct portfolios and one we maintain regardless of where we are in the cycle.
While reduced price volatility can be a positive byproduct of owning higher-quality businesses, the foundational goal is to reduce underlying fundamental uncertainty, especially when idiosyncratic uncertainty is high. When oil prices spike by over 90% (Brent crude began the year at $61 per bbl and ended the quarter at $118) as they did in early 2026, we can sleep soundly, knowing that the implications for the solvency or intrinsic value of the businesses we own are both structurally immaterial and episodically manageable.
We believe this characteristic, offering resilience in turbulent markets, translates into a better long-term investor experience and stronger compounded returns over full market cycles, irrespective of short-term price fluctuations.
Looking Ahead: Staying the Course with Discipline
We believe the more pressing concern heading into Q2 is whether policymakers can navigate an inflation environment that oil prices are actively complicating. Rising crude feeds into headline prints, headline prints constrain the Fed, and a constrained Fed cannot ease into softening growth. The late 1970s demonstrated how that sequence can escalate quickly once the Fed falls behind the curve. We are not predicting a repeat, but the direction of risk is clear.
That is the risk we are watching most carefully. It is also why we remain committed to owning businesses that do not need an accommodative Fed or ready access to capital markets to justify their value. Durable models with pricing power and strong cash generation compound through difficult periods precisely because their economics do not depend on the environment cooperating. That has been the core of our equity positioning, and nothing about Q1 changed that conviction.
Beyond core equity exposure, we continue to complement our portfolios with strategies designed to generate alpha independent of broad market direction. These allocations, spanning private real estate, select credit strategies, and managers with a demonstrated ability to add value through security selection and active risk management, are intended for environments like this one, with uncertain index-level returns and elevated dispersion across securities and sectors.
The long-term thesis remains unchanged. Quality compounding and patience remain the most reliable tools for long-horizon investors. We remain fully committed to that framework.
Disclosure
A&M Private Wealth Partners, LLC (“AMPWP”) is an SEC-registered investment adviser. SEC registration does not imply a certain level of skill or training. For additional information on the services AMPWP provides, as well as our fees for such services, please review our Form ADV at adviserinfo.sec.gov, contact us at 300 Banyan Boulevard, 10th Floor, West Palm Beach, FL 33401, or call us at (561) 268-0900.
This piece and its content reflect AMPWP’s views at the time of its writing, and the information presented and AMPWP’s views are for informational purposes only. Such views are subject to change at any time without notice including due to changes in market or economic conditions, and forward-looking statements or forecasts are based on assumptions and may not be realized. Future events and outcomes are inherently uncertain. Statements are subject to risks and uncertainties that could cause actual outcomes to differ. AMPWP has obtained information provided herein from various third-party sources believed to be reliable, however, such information is not guaranteed and is subject to errors, omissions, and changes. No reliance should be placed on the views and information presented when making any investment or liquidation decision. AMPWP is not responsible for the consequences of any decisions or actions taken or not taken as a result of the views and information presented, and AMPWP does not warrant or guarantee the accuracy or completeness of this piece or information presented.
Additional content may be relevant for further context or other insight. Portfolios should also be viewed in the context of the broad market and general economic conditions prevailing during the periods covered by performance and other information. Any references to future returns and/or risk are not promises of the actual return a portfolio may achieve nor do they reflect all risks. Not all investments are suitable for all investors. All investments involve risk of loss, including to principal, and all investors must be prepared to bear such loss. Different securities, strategies, and allocations have different costs and risks, and diversification also does not assure a profit nor protect against a loss. Past performance is not a guarantee of future results. Additionally, changes in investment strategies, contributions, or withdrawals may materially alter results, as may market conditions, other factors including but limited to economic factors, fees, expenses, and events. Nothing herein should be construed as an investment recommendation. AMPWP does not provide legal, accounting, or tax advice, and AMPWP’s services are not intended to act as a substitute for such advice. AMPWP encourages you to seek the counsel of a qualified attorney and/or accountant for legal, accounting, or tax advice.