

Alvarez & Marsal Private Wealth Partners: Fixed Income Portfolio Management Team Takeaways
- Solid quarter for municipals, driven by an unusually strong October. The market returned 1.56% in 4Q25, outperforming the U.S. Aggregate (1.10%), with October gains supported by $8.5B of fund inflows, compelling yields, and a Fed that resumed easing.
- Yield curve positioning was the story as the municipal yield curve flattened
- Income opportunity remains in intermediate and longer maturities, supporting barbell strategies and selective duration extension where appropriate
- 4Q supply was up about 14% year over year, but inflows absorbed it
- Credit focus shifted toward policy and funding exposure. Key quarter themes included federal funding pullbacks affecting select issuers, post-election scrutiny of New York City’s intergovernmental dynamics, State of Illinois’s upgrade to A2 (Moody’s), City of Chicago’s outlook revision to negative (S&P), and State of California’s LAO projecting a $18B shortfall in 2026 to 2027 with larger structural deficits thereafter.
Quarterly Returns and Drivers
The municipal bond market returned 1.56% for the 4th quarter, another solid performance following last quarter’s noteworthy 3.00% return.i Municipals outperformed the U.S. Aggregate Index, a blend of taxable fixed income bonds, which returned 1.10% for the period.
Most of the municipal market’s quarterly performance was generated in October, as the market saw a 1.24% return in the month,ii a performance atypical for October. While seasonally weak supply/demand dynamics usually weigh on the market, October 2025 saw substantial new cash, tallying $8.5B, flow into municipal funds,iii which provided strong support. Compelling yields, reasonably attractive valuations versus U.S. Treasuries, and the Federal Reserve continuing to ease rates all helped drive new demand. The 1.24% return was the best October performance since 1995.
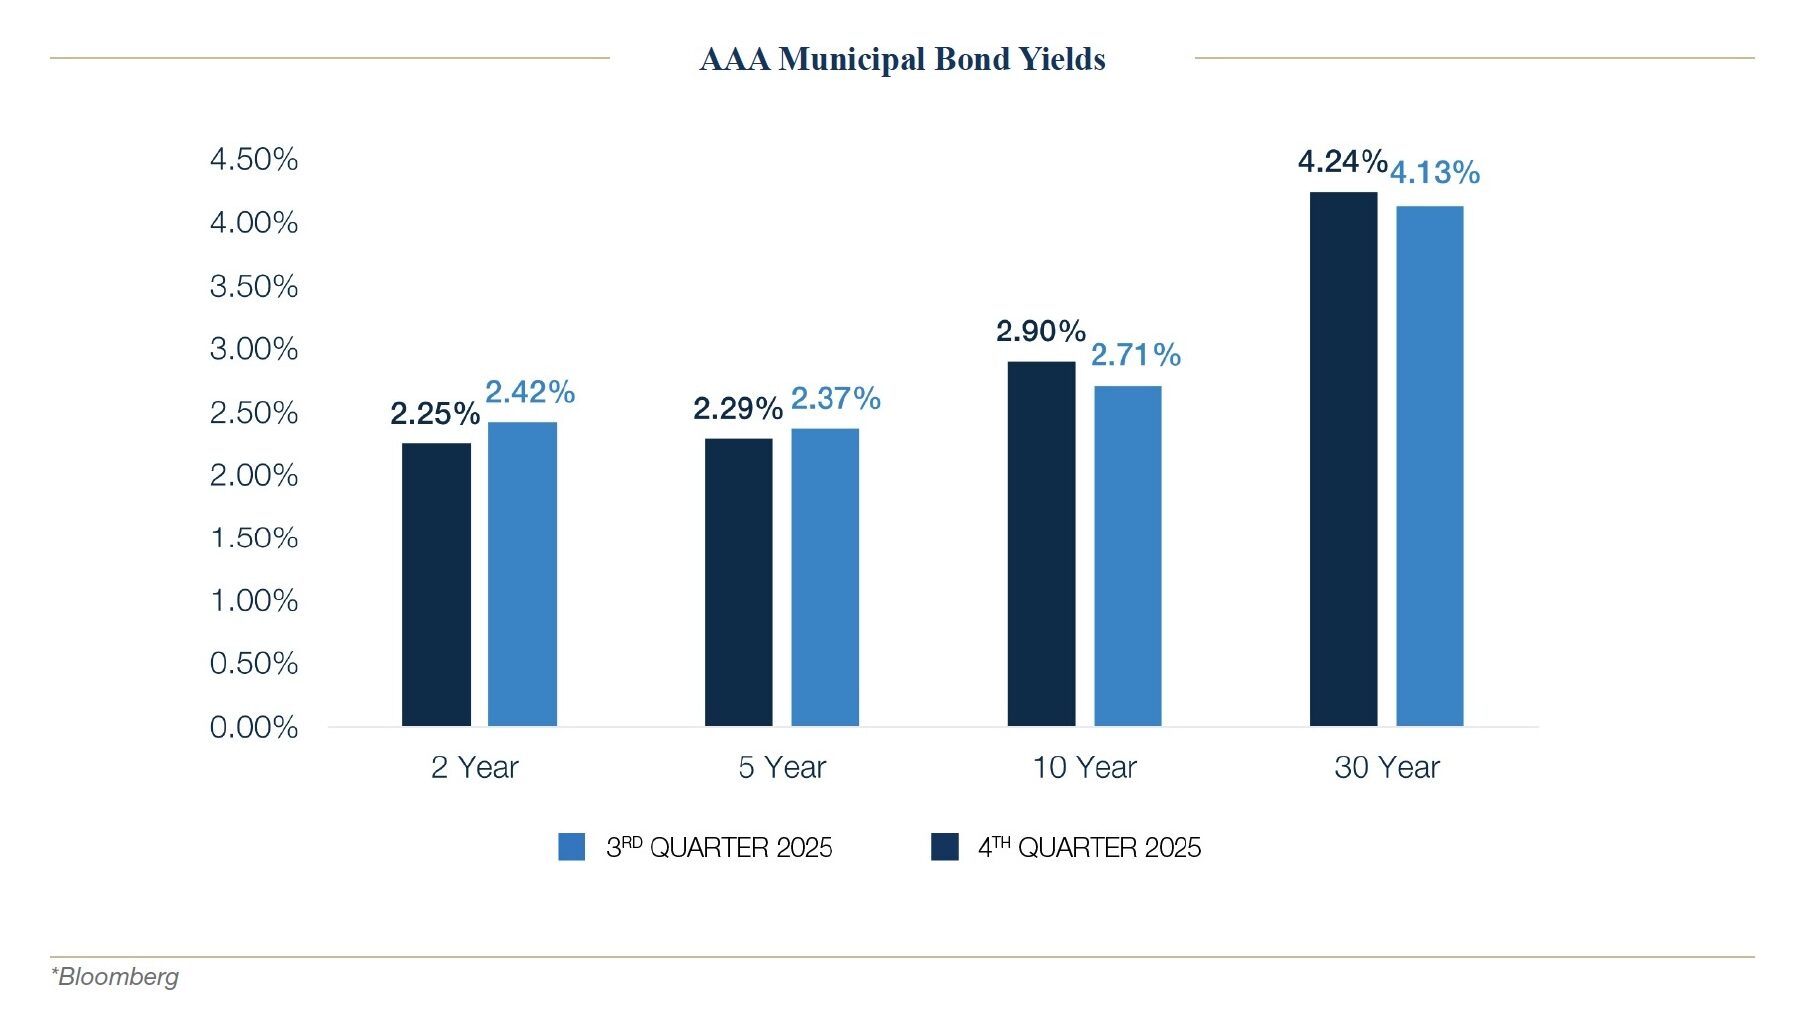
The municipal yield curve flattened in the 4th quarter, as short-dated bonds rose in yield and long-maturity bond yields declined. 2-year bonds saw yields climb 17 basis points, while 15-year maturity bonds performed best, with yields declining 27 basis points over the period.iv In performance terms, the Bloomberg Municipal 15-year Index returned 2.84% for the quarter, while the 3-year Index returned just 0.46%, as investors flocked to the attractive yields available further out the curve.
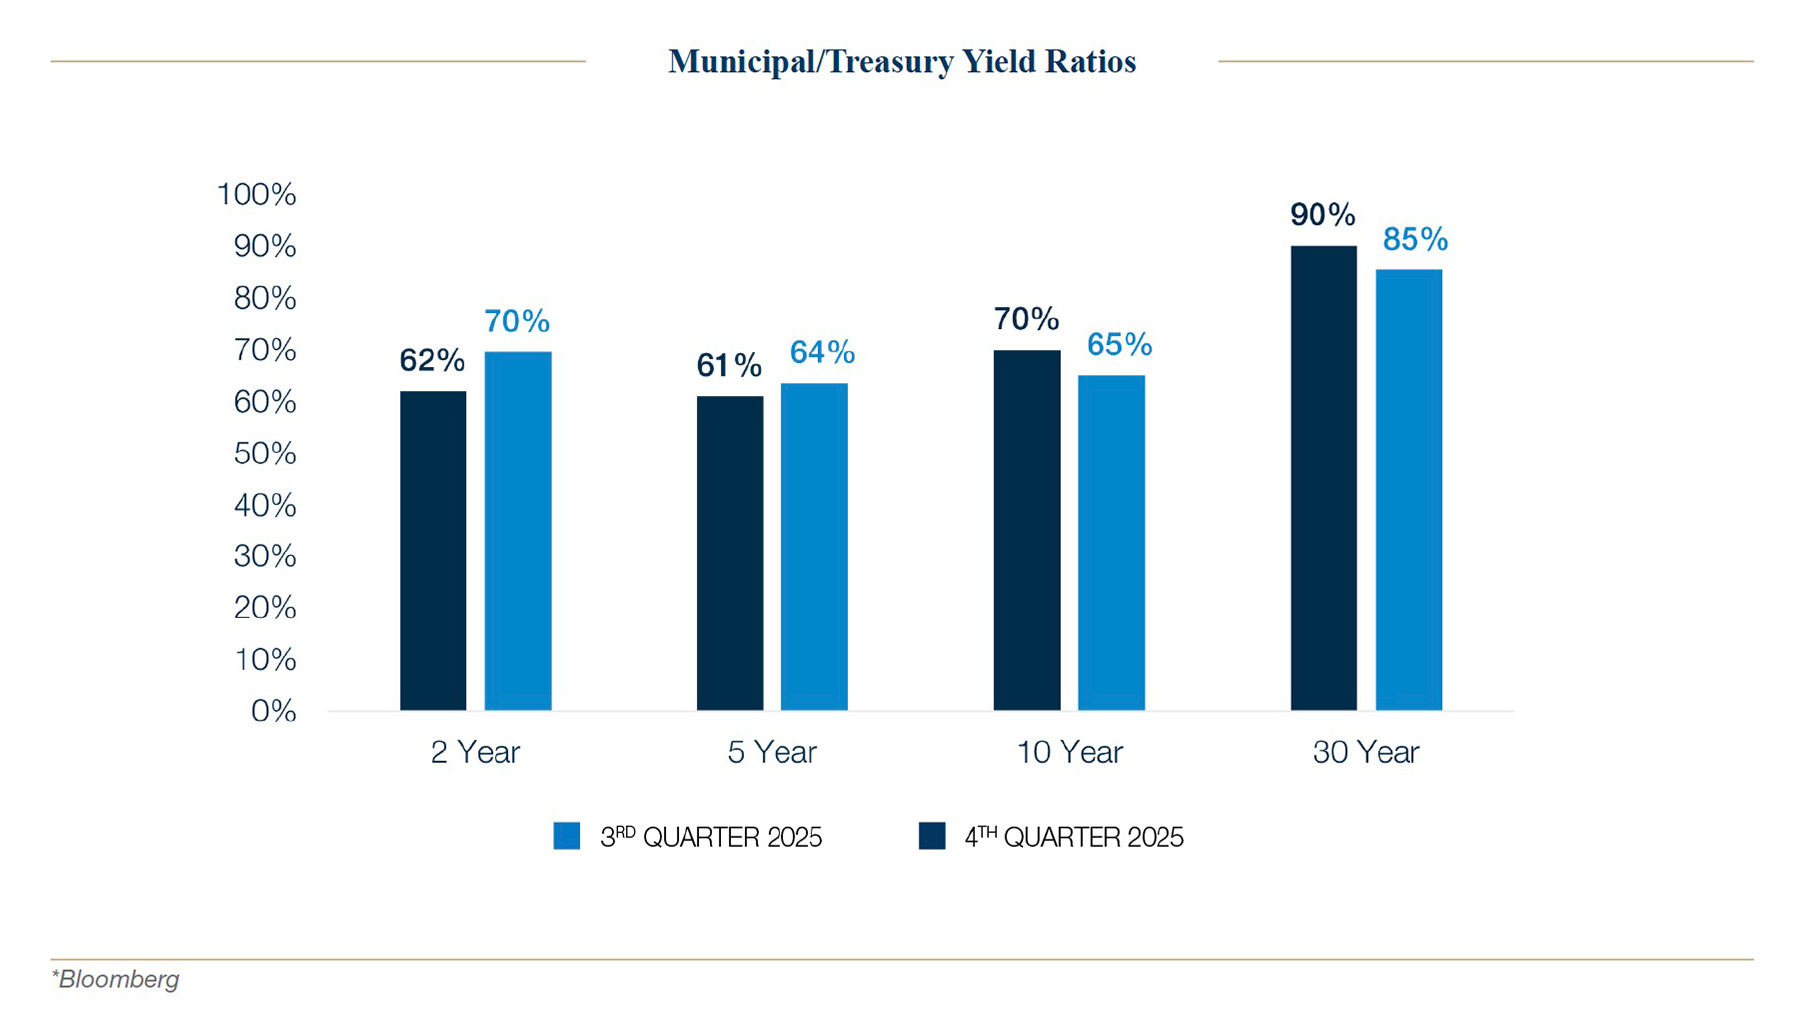
Compared with Treasuries, municipals underperformed notably in 2-year maturities but outperformed in maturities of 10 years and longer. The chart below shows this move: Municipal/Treasury yield ratios rose in 2-year maturities, while they declined in 10-year and 30-year maturities.
High-yield municipals lagged for the third quarter in a row, with the Bloomberg Municipal High-Yield index returning 1.15%. Brightline Trains, a large issuer in the high-yield segment that operates private rail systems, continued to experience distress in the quarter, which weighed on the non-investment-grade sector. Brightline Trains Florida ‘OpCo’ bonds, which initially received an investment grade BBB- rating from S&P when it was issued in April 2024, saw its rating cut from BB- to CCC in December, a deeply speculative grade rating.
Municipal 10-20 Year Yield Curve Segment
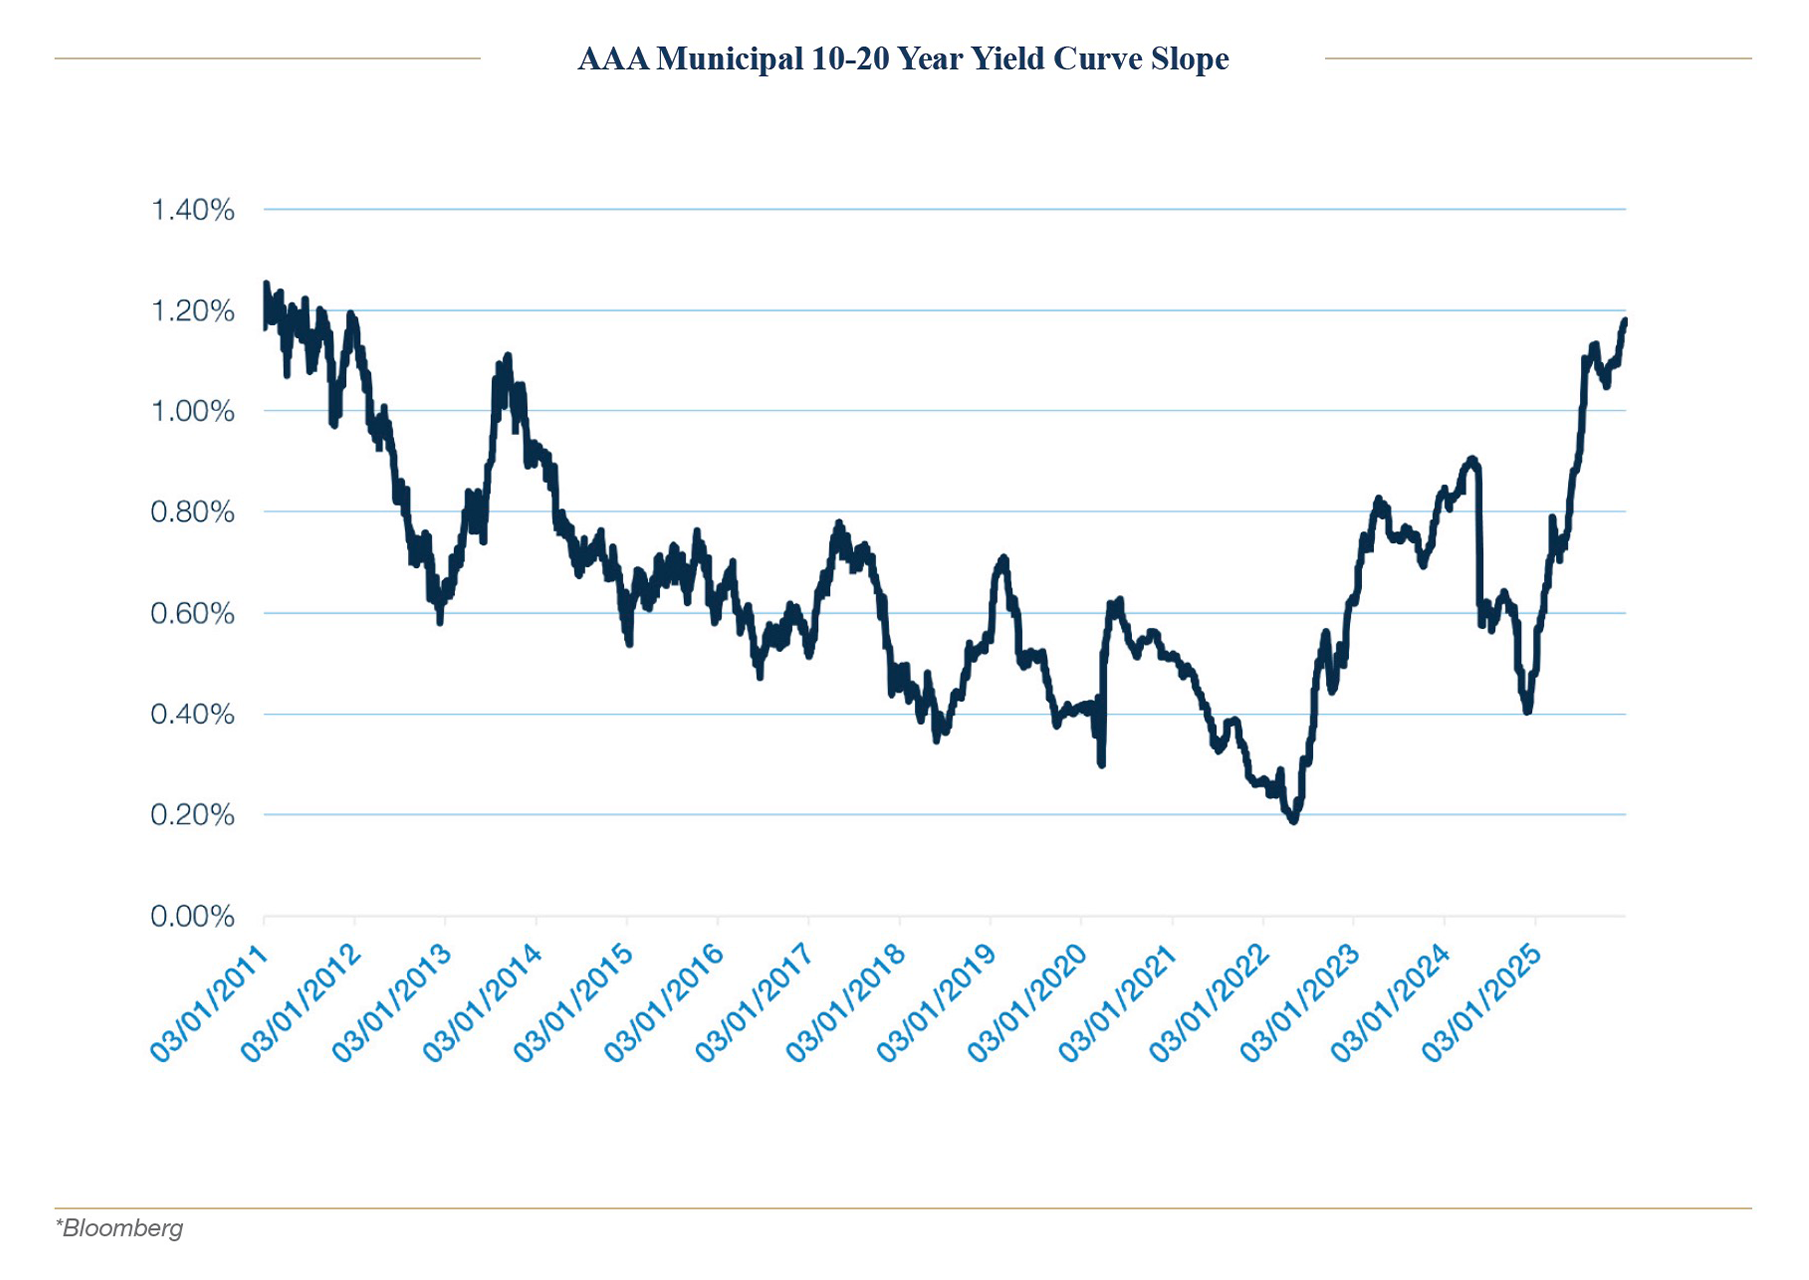
While the municipal curve flattened in the 4th quarter, certain ranges of the curve still stand at historically steep levels, which produces a considerable increase in yield by moving longer in maturity, compared to recent history. The chart below shows the slope of the 10-year-to-20-year segment of the municipal yield curve over the last 15 years. Put differently, the chart shows the difference in yield between 20-year and 10-year maturity municipal bonds over time. As of 12/31/25, the chart shows that AAA-rated bonds in 20 years yielded 118 basis points more than bonds in 10 years, which is close to the highest level on the chart.
For investors willing to extend duration or employ barbell strategies, we believe having some exposure in long-maturity municipals may prove effective in generating robust income for portfolios, given the current shape of the yield curve.
Economic Landscape
The quarter began with a U.S. government shutdown after Congress failed to pass a budget by the September 30th deadline. One of the largest repercussions for fixed income and other financial markets was the lack of economic data reporting. With the shutdown affecting the Bureau of Labor Statistics (BLS), many of the major economic data points that market participants rely on were not reported in the first part of the quarter.
Later during the period, the Government reopened, and data began to flow once again, however the accuracy of the data was called into question and discounted by some, as the data collection periods were affected by the shutdown. The lack of, and questionable accuracy of, the economic data led to lower volatility across fixed income markets, as investors had less meaningful data to spur trading decisions. The MOVE index, which measures U.S. bond market volatility, declined over the quarter and ended the period at the lowest levels since 2021.
In the same vein, the 10-year Treasury yield ended the quarter little changed, higher by just 2 basis points, and the 30-year Treasury yield movement was also subdued, with an 11 basis point move higher. The 2-year Treasury note declined in yield by 13 basis points, helped in part by the Federal Reserve’s 50 basis point reduction in the Fed Funds policy rate during the quarter.
The Federal Reserve – Resuming the Cutting Cycle
After a prolonged pause for the better part of nine months, the Fed began cutting interest rates again in September, dropping interest rates by 25 basis points at the September, October, and December meetings.
As the October FOMC meeting commenced, with limited economic data to analyze and concerns still lingering surrounding the labor market, the Fed decided to cut the Fed Funds policy rate by 25 basis points. The Committee also ended its balance sheet runoff program known as quantitative tightening. While the cut was welcomed by fixed income investors, it was surrounded by hawkish commentary from Chair Powell regarding further cuts at the December meeting, as he stated, “a further reduction in the policy rate at the December meeting is not a foregone conclusion. Far from it, policy is not on a preset course.”v The statement threw cold water on a subsequent cut in December, which futures markets had fully priced in prior to the October FOMC meeting.
Later in the quarter, more dovish comments from Fed Governors Williams and Waller reset the tone for the December meeting, and appeared to telegraph that the Fed was poised to cut again in December—and that is indeed what market participants saw.
After the interest rate cuts in the 4th quarter, the Fed Funds rate ended in the 3.50-3.75% range.
The cuts appeared to drive inflows to municipal funds, as investors became more comfortable adding duration, and as cash money market yields, which continued to decline after the cuts, became a less attractive investment.
Municipal Market Deeper Dive: Record New Issue Supply, but Fund Inflows Brought Support.
The municipal market set a new issue supply record in 2025, topping the previous record in 2024, as $593B in deals priced.vi The 4th quarter of this year saw a 14% increase in supply compared to the same quarter in 2024vii.
Some highlights included the prepaid gas and electricity sector, which saw $31B of new issuance in 2025, a record for the sector and a 24% increase over last year.viii New ‘funding recipient’ entrants, an important party for these deals, along with a broadening buyer base for the sector, drove the increased supply.
The higher education sector also saw heavy supply, with the $36B issuance total the highest seen for any year since at least 2002.ix Federal funding pressures, along with endowment allocations tied up in alternative investments, created liquidity needs for some universities, helping to drive the increased issuance.
The heavy supply was counterbalanced with strong new cash coming into the market, measured by inflows to municipal funds. Municipal funds saw a total of $51B of net inflows in 2025, the 5th highest yearly inflow total on record since 1992.x A substantial portion of the inflows came in the 4th quarter, helping to absorb the heavy supply and leading to the 1.56% return for the period, which outperformed most taxable fixed income asset classes.
Notable Municipal Market Action in 4Q25
Spreads in the prepaid sector widened toward the end of the quarter, mainly driven by relentless new issue supply. 10-year term bonds in the sector appeared to widen more compared to shorter bonds, with Bloomberg’s 10-year A-rated index for the sector showing spreads moved from +115 to +154 at the end of the quarter.xi
Longer-dated New York City general obligation bond spreads modestly widened during the quarter after Zohran Mamdani’s Mayoral victory.xii Uncertainty swirled regarding the fiscal trajectory of the city, given the new Mayor’s intended policies.
4th Quarter 2025 Credit Review
Summary Points
Credit-related news during the 4th Quarter was essentially derived from a culmination of events that began in January with the new Trump Administration. From early on, the Municipal market was under pressure on multiple fronts that ranged from the threats of removing tax-exemption to the enacted cuts to Medicaid. In all, credit pressure was experienced across multiple sectors. During the 4th Quarter, the Trump Administration’s pullback of funding for specific municipal credits, New York City’s Mayoral Election, the State of Illinois’s credit rating upgrade by Moody’s, Standard & Poor’s outlook revision to negative for the City of Chicago, and California’s Legislative Analyst Office’s 2026-27 Fiscal Outlook warranted attention.
Administration’s Funding Pullback
In October, the White House halted $18B in New York infrastructure funding due to concerns over ‘unconstitutional’ diversity and inclusion practices, according to a social media post from Russell Vought, the director of the US Office of Management and Budget. During the same period, the Federal Administration halted $2B for Chicago Transit, the Department of Energy cancelled $8B in funding for climate initiatives in 16 states, and the White House Press Secretary said the administration has begun reviewing aid that could be cut in Portland, OR.xiii
The election of Zohran Mamdani, New York City’s 111th Mayor
- Zohran Mamdani’s election and campaign platform proposals, such as “fare-free city buses; public childcare; city-owned grocery stores; a rent freeze on rent-stabilized units; additional affordable housing units; comprehensive public safety reform; and a $30 minimum wage by 2030,” drew attention and cast a shadow on NYC finances.xiv
- We believe the likelihood and actual materiality of implementing wholesale reforms remain lower than the headlines would suggest, as several key proposals would require support from Albany. Importantly, navigating the relationship between the Federal government and New York City gained attention.
For perspective, last December, NYC’s comptroller published a report, NYC’s Federal Funding – Outlook Under Trump, that highlighted the City’s federal funding and potential risks.xv
NYC’s Federal Funding – Outlook Under Trump (summary points):
- While emergency funding does not currently account for a large share of the FY 2025 budget, federal aid can play a critical role in the City’s budget during crises. For example, as a response to Hurricane Sandy, the federal government has provided $5.6B of operating revenue from FY 2013 to FY 2025 for disaster recovery and continued remediation.
- Most recently, federal aid to New York City in response to the COVID-19 pandemic has totaled $26.5B through FY 2025.
- Although not currently a large share of the City’s financial plan in the coming years, were the City to experience another unforeseen disaster, any potential risk to federal emergency funding cannot be understated.
- In addition to its year-to-year operating budget, the City also receives federal funding to undertake longer-term capital infrastructure projects. In the September 2024 Capital Commitment Plan (FY 2025 to FY 2028), the City includes $2.56B in federal funding, with $941M anticipated in FY 2025 alone. The highest level of capital support is for Department of Transportation (DOT) projects at $728M total through FY 2028 and $290M for the Department of Parks and Recreation (DPR), also through FY 2028.
State of Illinois’s Credit Rating Upgrade
In October, Moody’s upgraded the State of Illinois’s general obligation bond rating to A2 from A3. According to Moody’s, the upgrade is driven by realized and expected improvement in the State’s financial metrics. Per Moody’s, the State’s A2 issuer rating balances continued improvement in financial metrics with credit challenges stemming from high leverage, limited operating flexibility, and below-average economic performance.
According to Moody’s, Illinois remains an outlier among states for exposure to unfunded pension obligations that contribute to high leverage and fixed costs. The State’s operating flexibility is constrained by its high fixed cost burden, as well as constitutional provisions that protect post-employment benefits and prohibit certain changes in tax structure. Although Illinois’ fund balance and budget reserves continue to reach historic highs, they both remain lean as a share of revenue compared to those of other states, making Illinois more susceptible to downward shifts in the economic climate or material changes in federal funding.xvi
City of Chicago’s Negative Outlook
In November, Standard & Poor’s (S&P) lowered its credit outlook to Negative from Stable after Mayor Brandon Johnson proposed a partial supplemental pension contribution next year. The revision was prompted by the City’s reliance on one-time measures in the fiscal 2026 budget proposal and its significantly diminished balance sheet.
According to S&P, the Negative outlook reflects the view that there is at least a one-in-three chance of a lower rating within our two-year outlook horizon, as they evaluate Chicago’s G.O. credit performance in light of factors that include: (i) the final fiscal 2026 budget and actual performance during the year relative to the budget; (ii) City leadership’s efficacy in delivering structural solutions to address the gap as the city draws on recent consultant and task force reports identifying wide-ranging gap-closing options; and (iii) the fate of the City’s advance pension payment, as the payment is set to grow considerably next year and may prove an ongoing challenge absent additional budget adjustments.xvii
California’s Legislative Analyst Office’s 2026-27 Fiscal Outlook
As reported, each year, the Legislative Analyst Office LAO publishes the Fiscal Outlook in anticipation of the upcoming budget season. The report gives the Legislature independent estimates and analysis of the state’s General Fund budget condition with the goal of helping lawmakers prepare for the 2026-27 budget process.
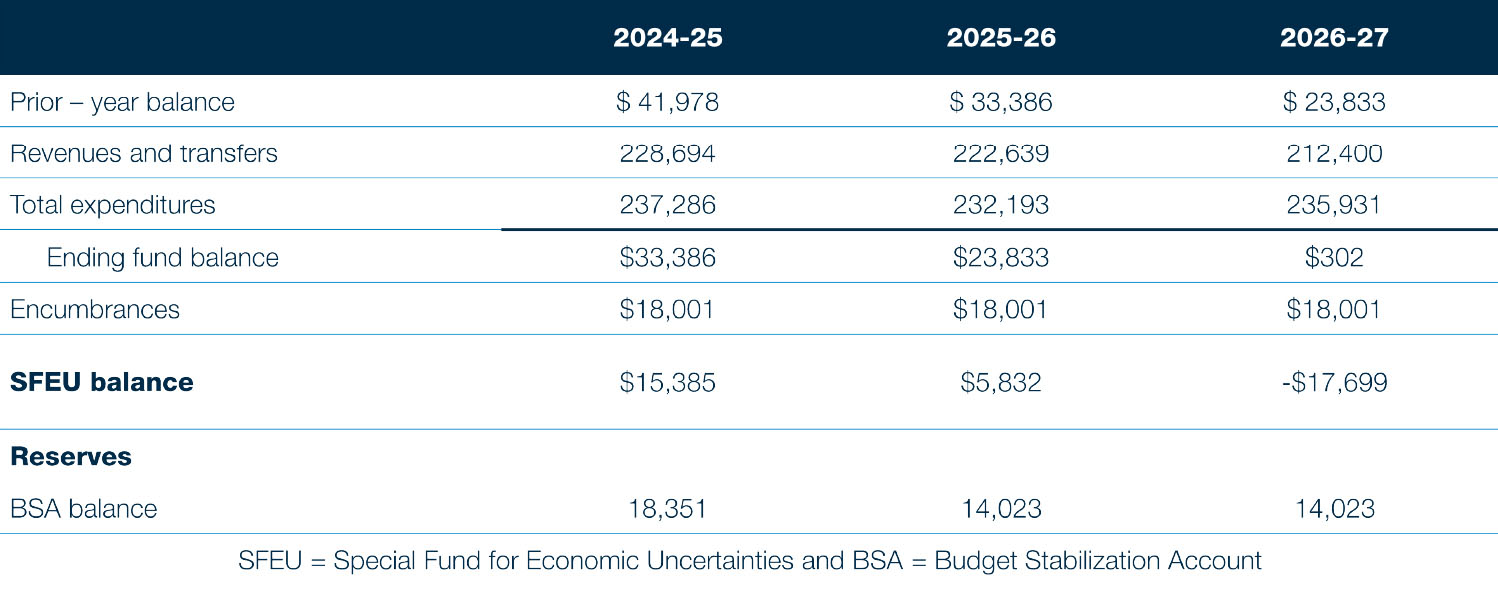
Under the LAO’s current spending estimates, they are projecting California will face a roughly $18B General Fund budget shortfall in 2026 27 and structural deficits of approximately $35B annually beginning in 2027 28, driven by spending growth outstripping revenue growth. Recent revenue strength—largely from AI driven stock market gains—does not close the gap because constitutional requirements (Propositions 98 and 2) absorb most of the upside.
- Proposition 98: Established an annual minimum funding guarantee for public K-12 schools and community colleges
- Proposition 2: Requires 1.5% of general fund revenues and an amount equal to revenues derived from capital gains-related taxes in situations where such tax revenues are in excess of 8% of general fund revenues to be deposited into the Budget Stabilization Fund (BSA)
General Fund Condition under LAO’s Fiscal Outlook (in Millions) | 2026-27 Revenues & transfers: $212.4B; expenditures: $235.9Bxviii
ii See Endnote i
iii Lipper data. $8.5B of inflows in October.
iv Bloomberg
v https://www.reuters.com/world/us/fed-meeting-updates-rate-cut-expected-powell-speak-2025-10-29/
vi See endnote iv
vii See endnote iv
viii See endnote iv
ix See endnote iv
x Lipper reporting funds. Some monthly reporting funds were still left to report December flows at time of writing.
xi Bloomberg U.S. Gas Forward Contract A- Muni BVAL Yield Curve 10 Year. BVAL 10 year callable AAA yield curve. Spread is over AAA
municipal yield
xii Bloomberg. Using cusip 64966SJZ0 as reference (2054 maturity). Spread went from +39 on 10/31 to +49 as of 12/31, reaching as high as +64
xiii Fortune, White House freezes $18 billion in NYC funding as shutdown hits 10/01/25
xiv https://www.zohranfornyc.com/platform
xv New York City Comptroller, Brad Lander – NYC’s Federal Funding: Outlook Under Trump 12/10/25
xvi Moody’s publication: Moody’s Ratings upgrades Illinois to A2; outlook stable 10/23
xvii S&P’s publication: S&P Chicago GO Debt Rating Outlook Revised To Negative From Stable On Persistent Deficits; ‘BBB’ Rating Affirmed 11/05/25
xviii LAO The 2026-27 Budget: California’s Fiscal Outlook, November 2025
Disclosure
A&M Private Wealth Partners, LLC (“AMPWP”) is an SEC-registered investment adviser. SEC registration does not imply a certain level of skill or training. For additional information on the services AMPWP provides, as well as our fees for such services, please review our Form ADV at adviserinfo.sec.gov, contact us at 300 Banyan Boulevard, 10th Floor, West Palm Beach, FL 33401, or call us at (561) 268-0900.
This piece and its content reflect AMPWP’s views at the time of its writing, and the information presented and AMPWP’s views are for informational purposes only. Such views are subject to change at any time without notice including due to changes in market or economic conditions, and forward-looking statements or forecasts are based on assumptions and may not be realized. Future events and outcomes are inherently uncertain. Statements are subject to risks and uncertainties that could cause actual outcomes to differ. AMPWP has obtained information provided herein from various third-party sources believed to be reliable, however, such information is not guaranteed and is subject to errors, omissions, and changes. No reliance should be placed on the views and information presented when making any investment or liquidation decision. AMPWP is not responsible for the consequences of any decisions or actions taken or not taken as a result of the views and information presented, and AMPWP does not warrant or guarantee the accuracy or completeness of this piece or information presented.
Additional content may be relevant for further context or other insight. Portfolios should also be viewed in the context of the broad market and general economic conditions prevailing during the periods covered by performance and other information. Any references to future returns and/or risk are not promises of the actual return a portfolio may achieve nor do they reflect all risks. Not all investments are suitable for all investors. All investments involve risk of loss, including to principal, and all investors must be prepared to bear such loss. Different securities, strategies, and allocations have different costs and risks, and diversification also does not assure a profit nor protect against a loss. Past performance is not a guarantee of future results. Additionally, changes in investment strategies, contributions, or withdrawals may materially alter results, as may market conditions, other factors including but limited to economic factors, fees, expenses, and events. Nothing herein should be construed as an investment recommendation. AMPWP does not provide legal, accounting, or tax advice, and AMPWP’s services are not intended to act as a substitute for such advice. AMPWP encourages you to seek the counsel of a qualified attorney and/or accountant for legal, accounting, or tax advice.