

Alvarez & Marsal Private Wealth Partners: Fixed Income Team Takeaways
Overview
- A strong quarter start, then a sharp rate shock in March. Municipals returned -0.18% in 1Q26, slightly behind the U.S. Aggregate at -0.05%. January and February were constructive, but March turned negative as the Iran conflict pushed oil prices higher and reignited inflation concerns.
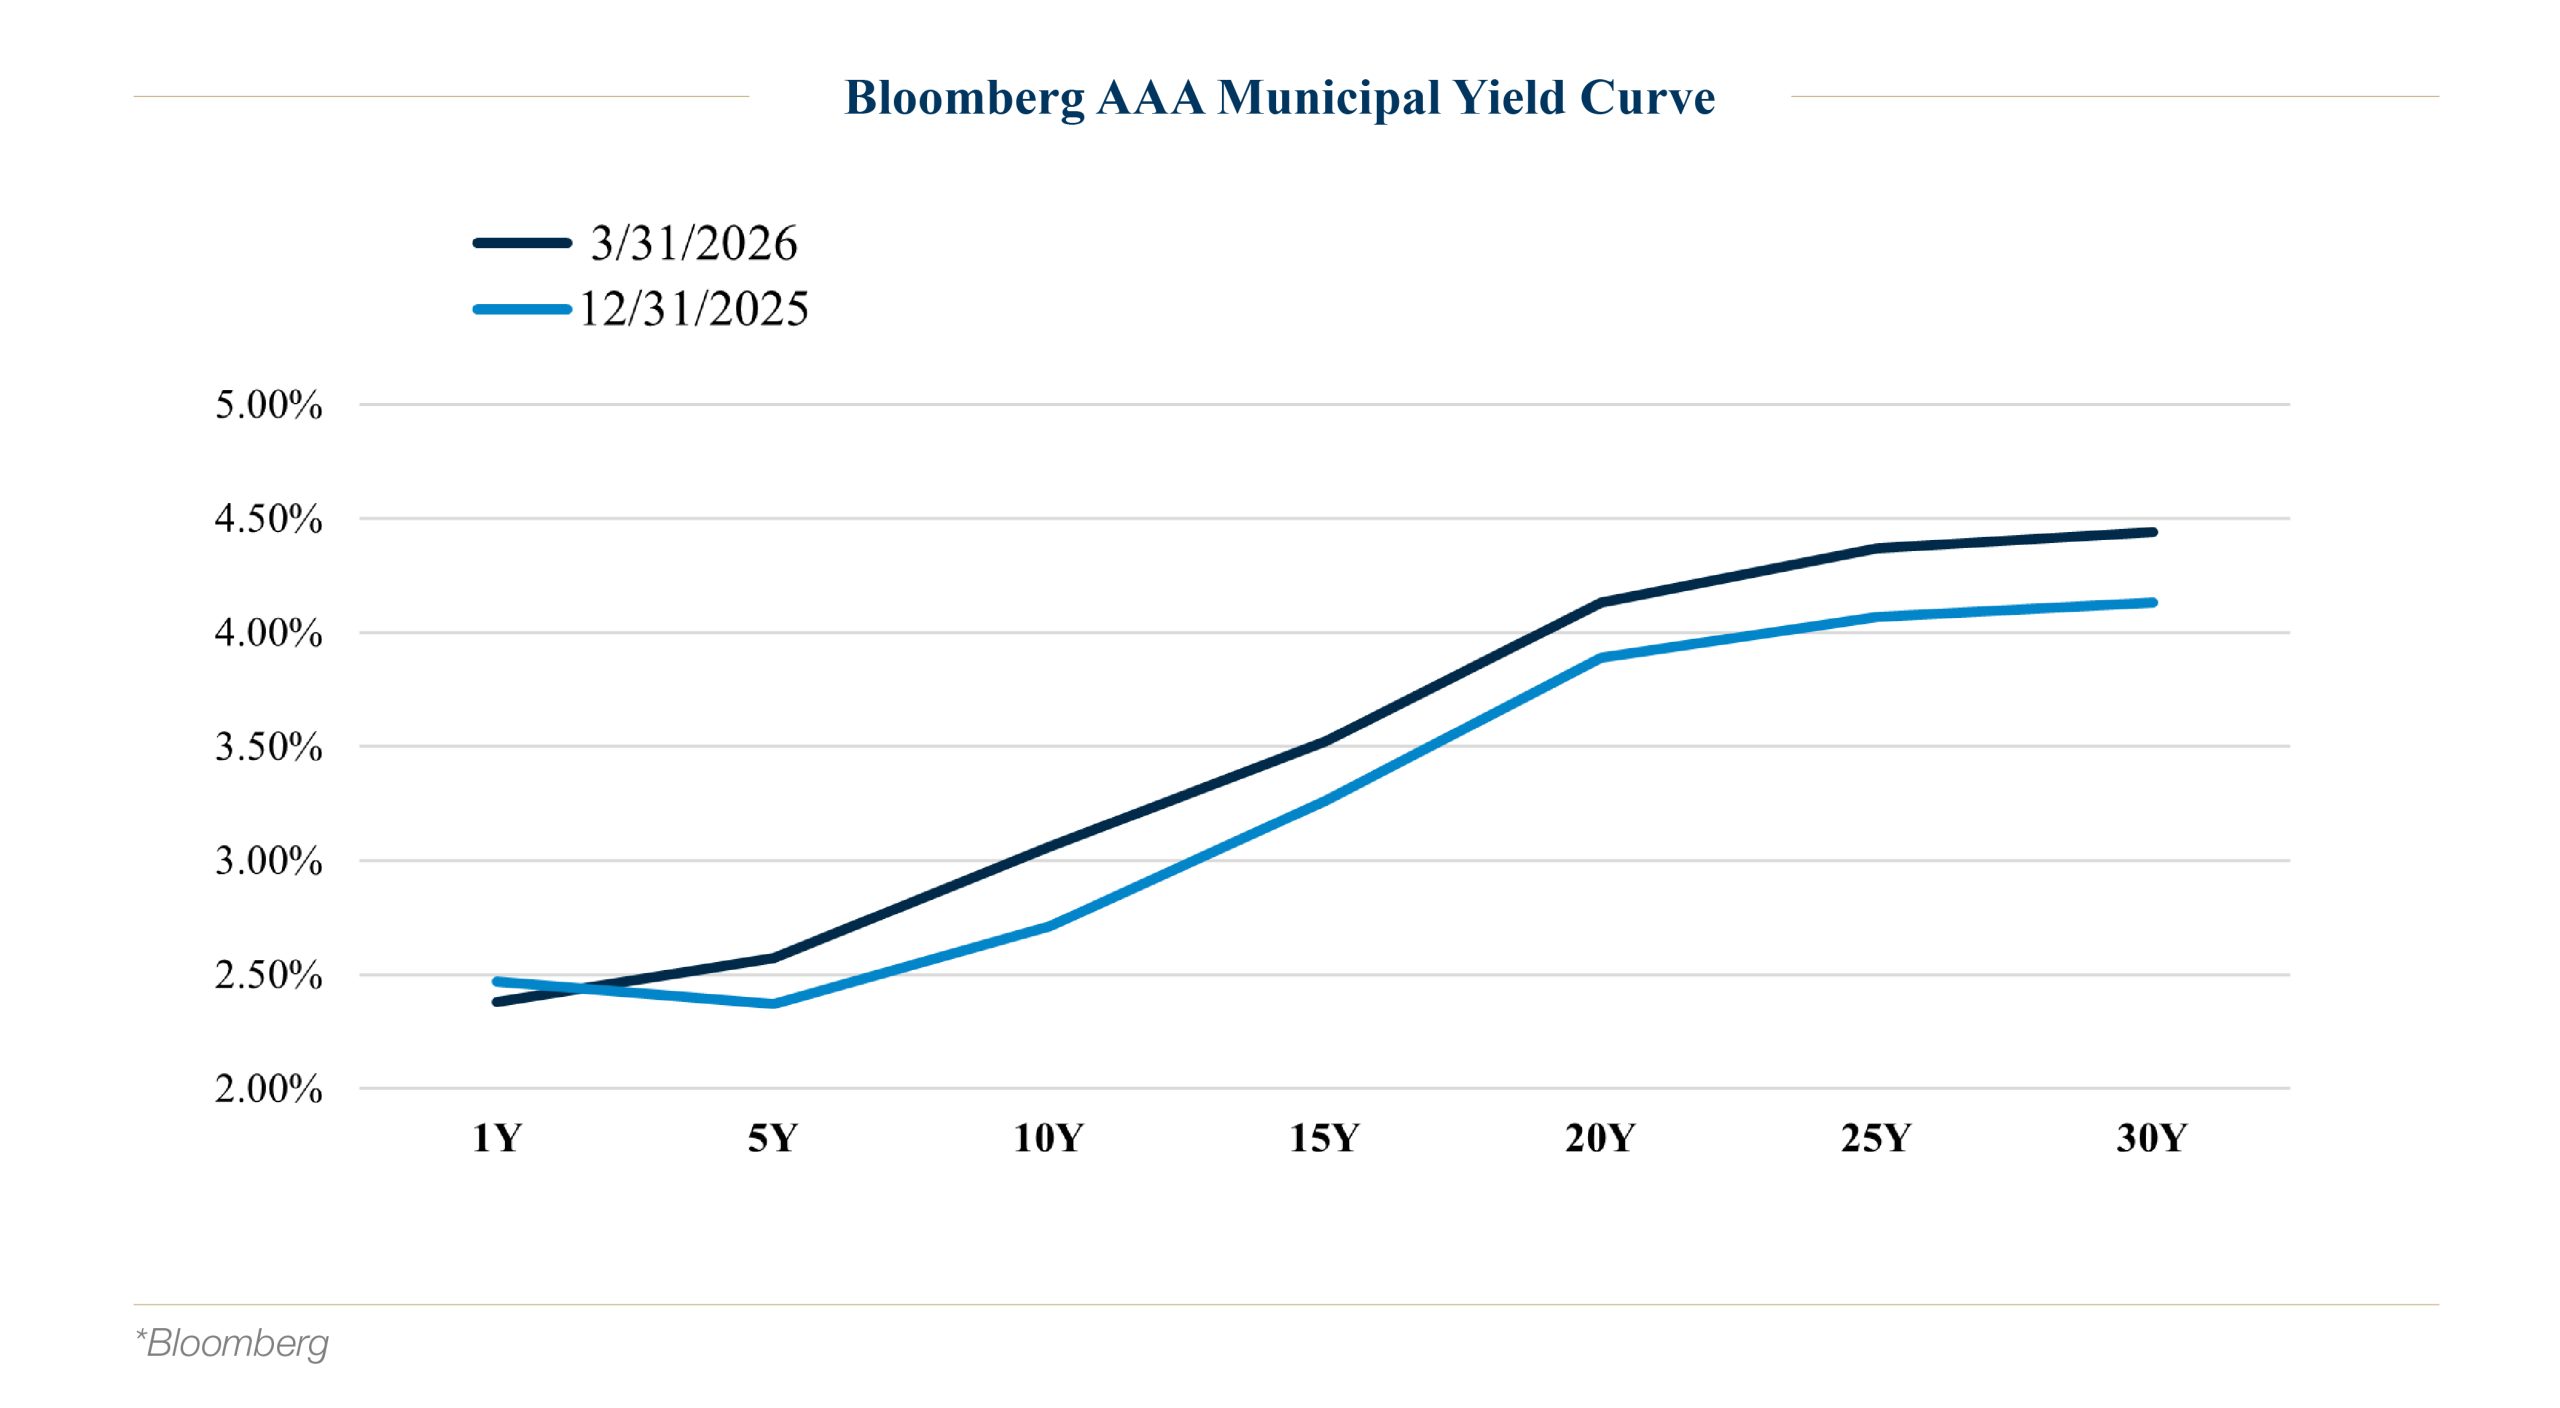
- From February 28 through quarter-end, the 10-year Treasury yield rose about 38 basis points. AAA 2-year yields edged lower, while AAA 10-year yields rose materially, pressuring intermediate returns.
- The municipal curve steepened early, with the 10- to 20-year slope reaching about 135 basis points, then flattened as investors moved out the curve to capture higher yields.
- The unemployment rate remained steady, and core price inflation was above target. The Fed left rates unchanged in the quarter.
- Credit attention clustered around policy and rating actions. Key quarter themes included new state tax initiatives (Washington’s millionaire tax and California’s proposed billionaire tax), Chicago’s downgrades tied to persistent structural imbalance, revisions to New York City’s outlook to negative, and ongoing rating agency work on nonprofit healthcare and California wildfire risk.
Quarterly Returns and Drivers
The Bloomberg Municipal Bond Index returned -0.18% for the 1st quarter, slightly underperforming the U.S. Aggregate Index, a blend of taxable fixed income bonds, which returned -0.05%.i
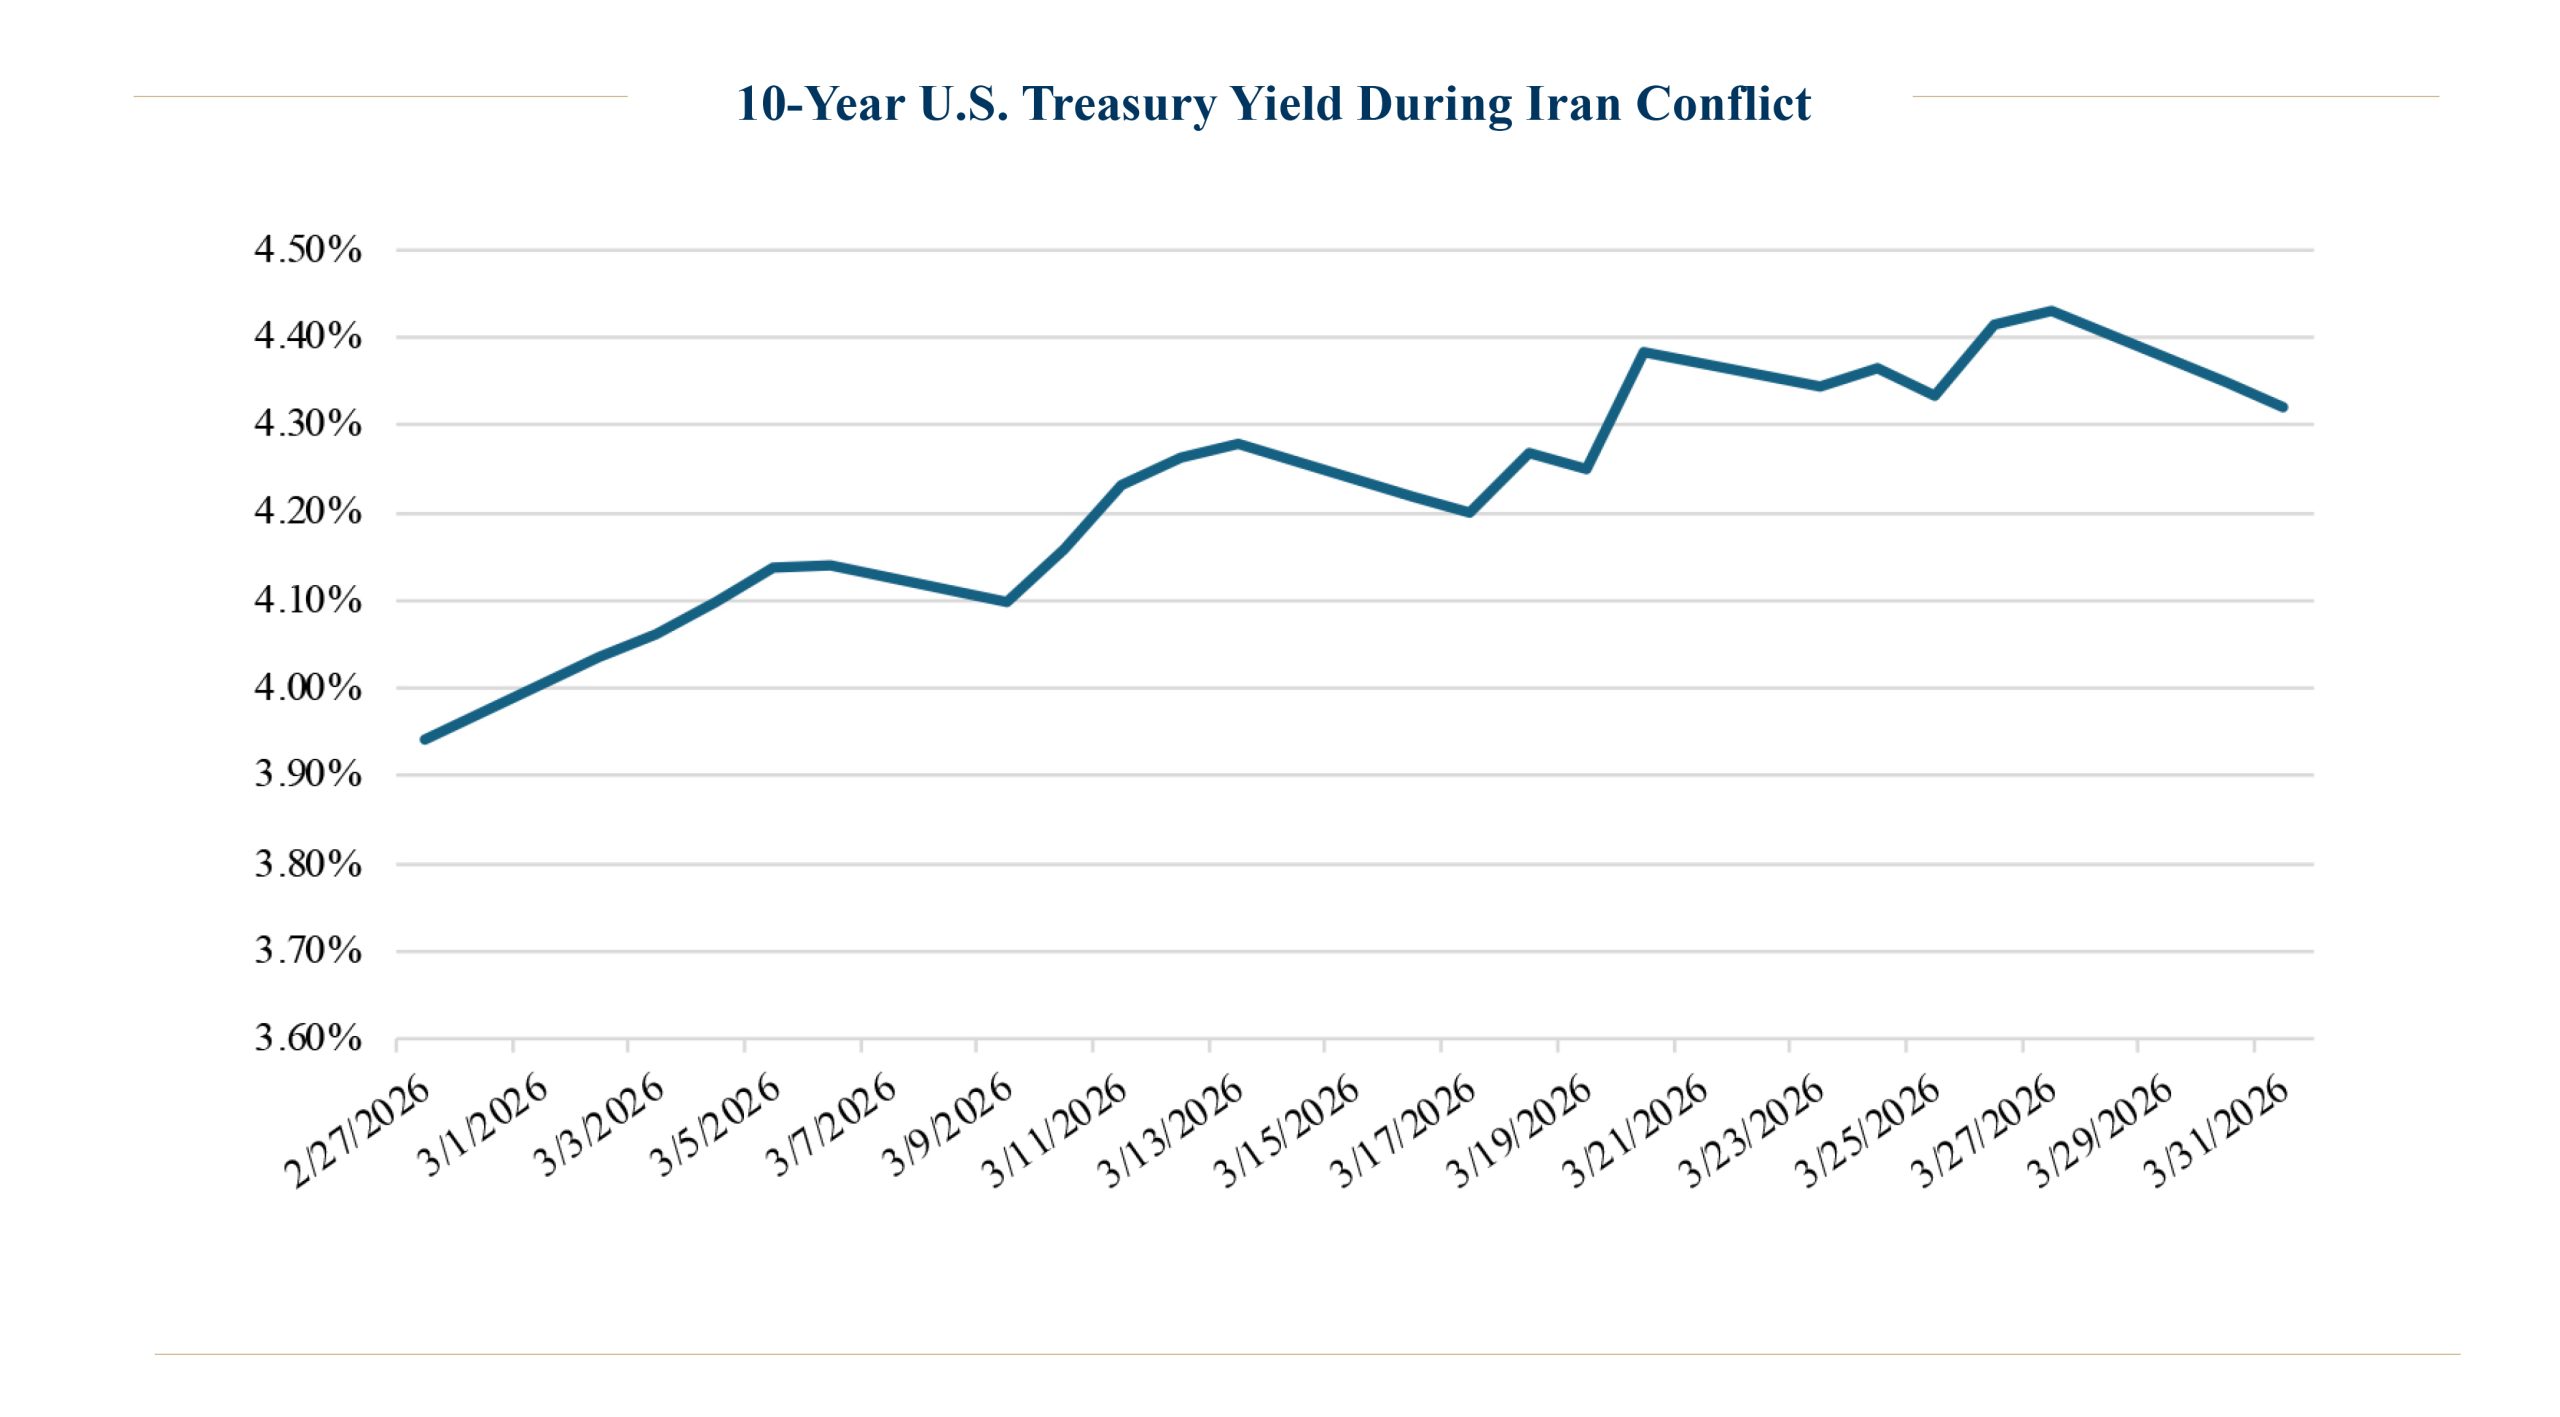
The negative return for municipals was centered entirely in March, as the Iran conflict and resulting oil price spike created inflation worries across financial markets. Oil prices, represented by West Texas Intermediate, ended March at $101.38/bbl after starting the month at $67.02/bbl. In response to the inflation concerns, bond yields across the globe rose, pressuring returns.
From the start of the conflict on February 28th through the end of the quarter, the 10-year U.S. Treasury yield rose 38 basis points:
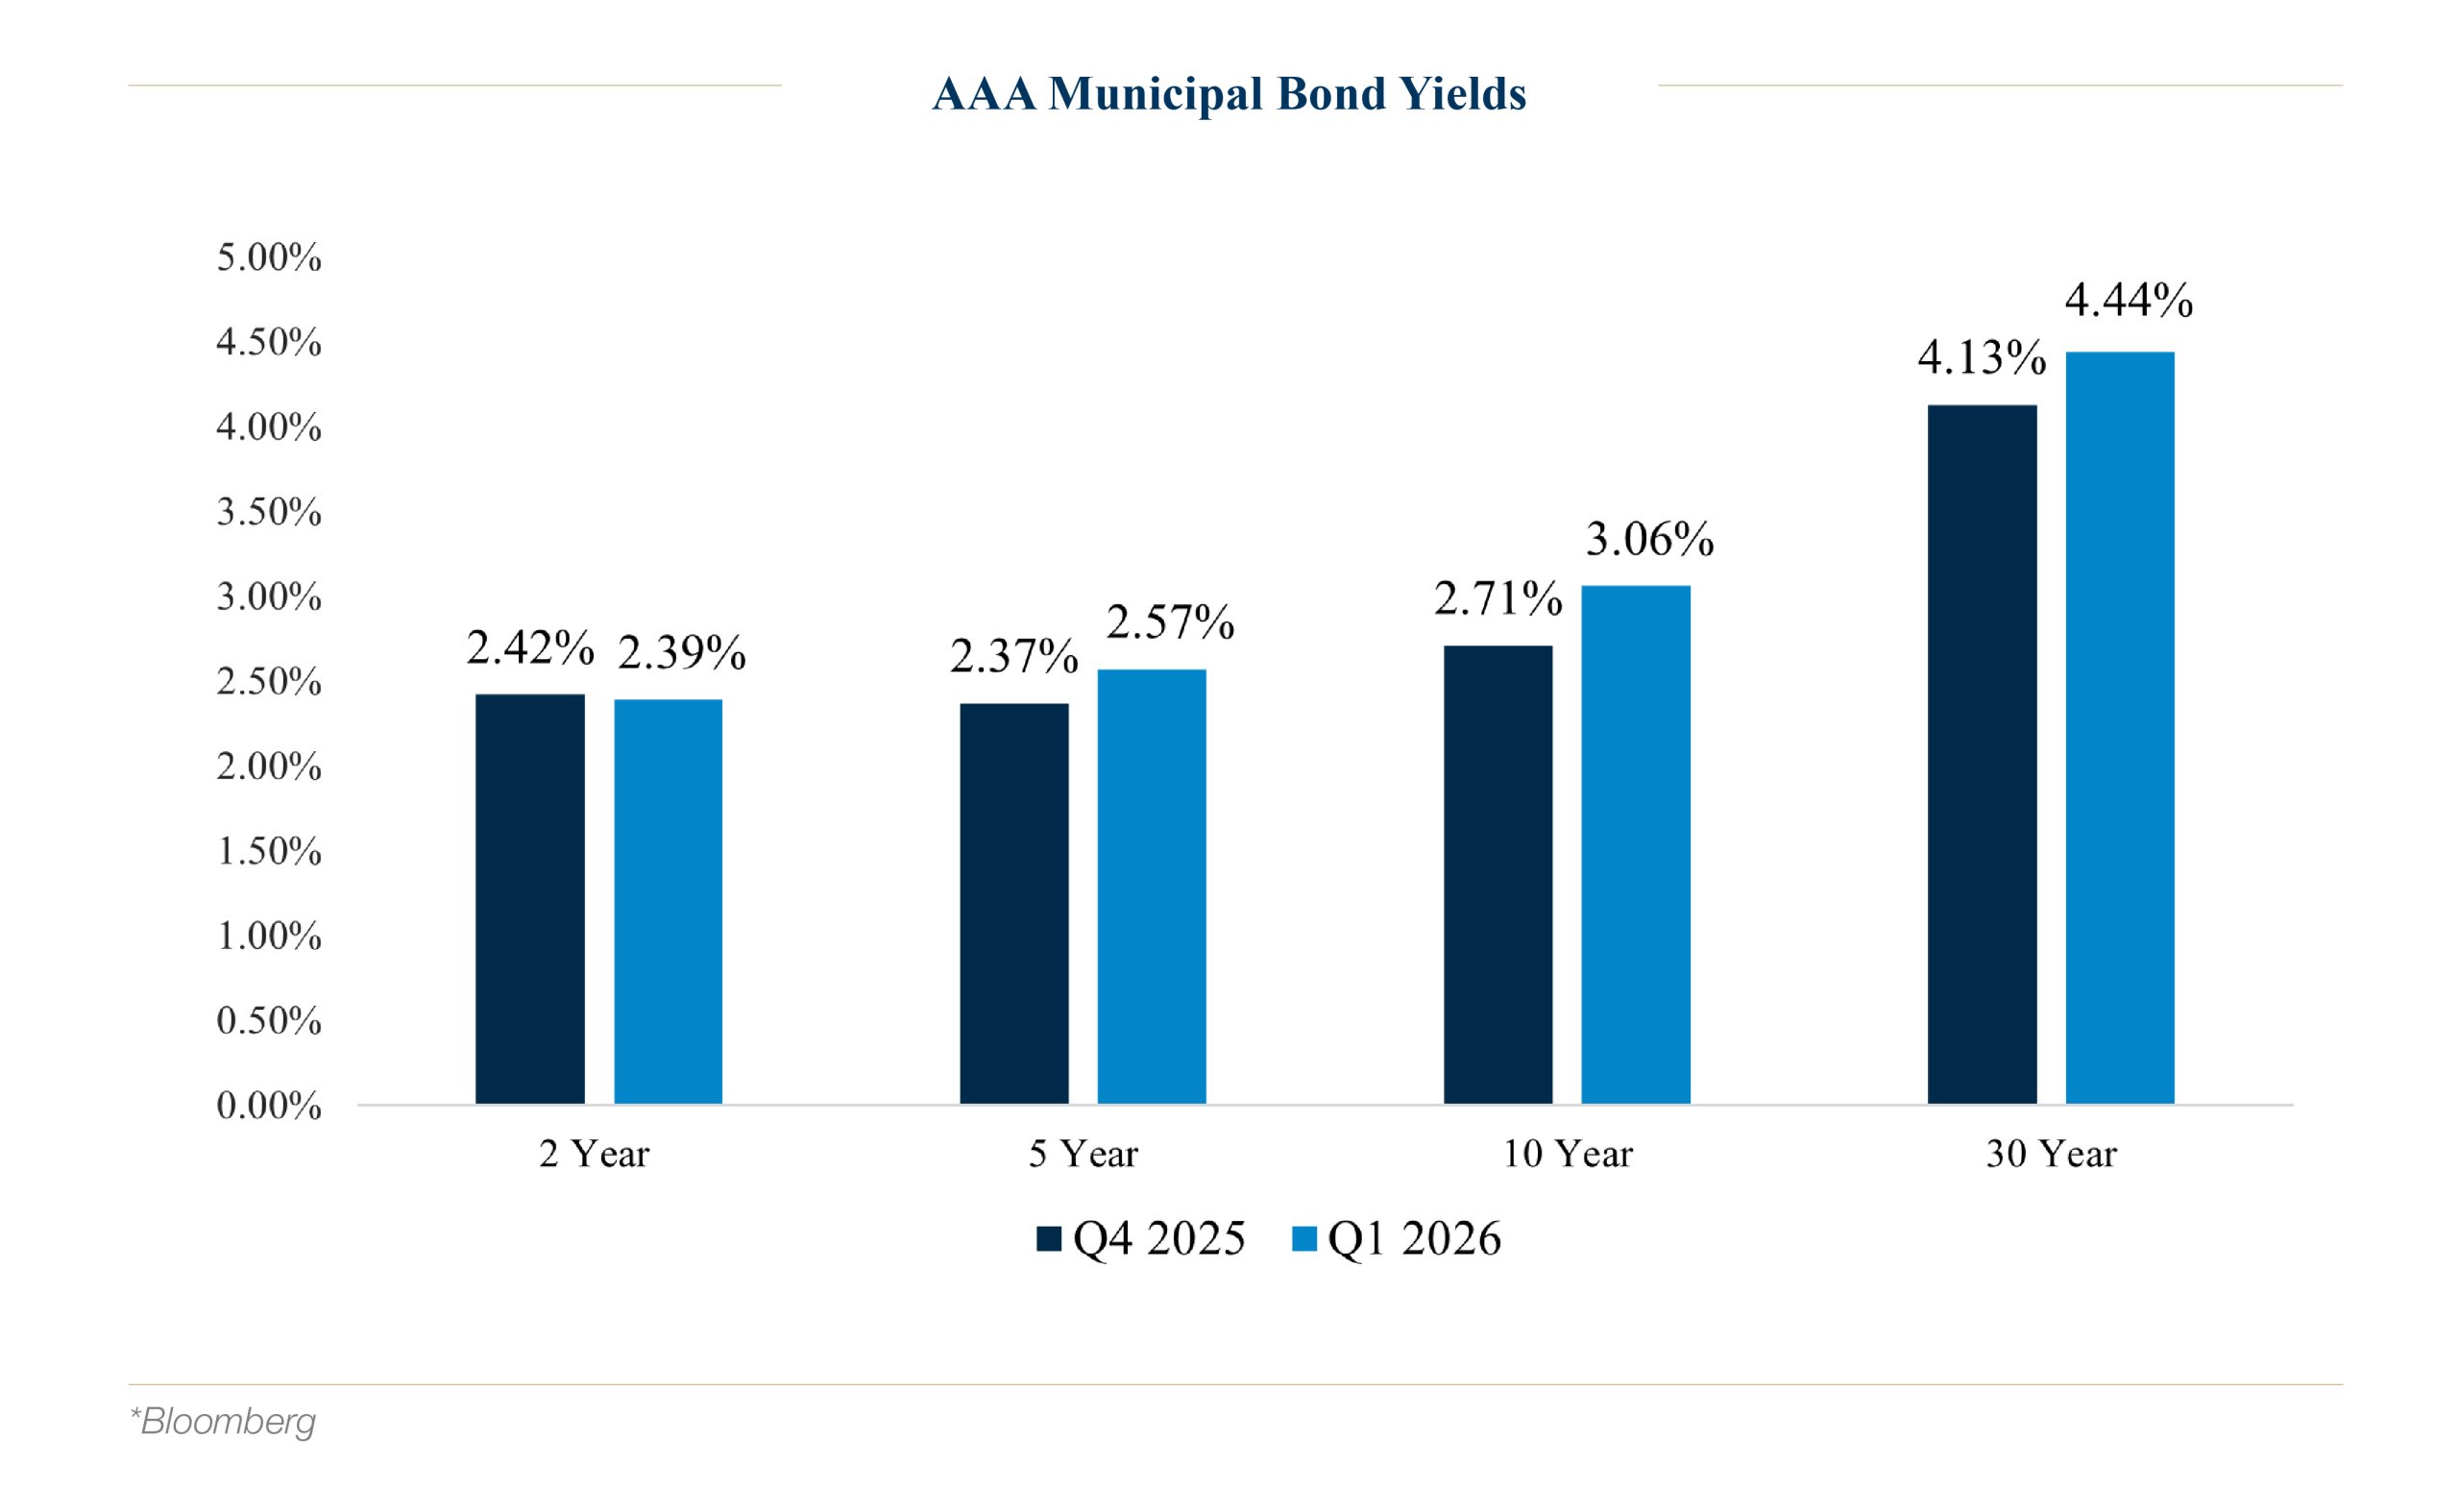
Municipal bond yields also rose across most of the curve during the quarter, dragged higher by U.S. Treasury yields, and as support from municipal fund inflows waned in March. AAA-rated 2-year yields declined slightly by 3 basis points over the period, while 10-year maturities fared worst, rising in yield by 35 basis points.ii
Lower-rated bonds outperformed higher-quality bonds during the period, as the Bloomberg Municipal Bond High Yield index returned 0.71% compared to the investment-grade index’s -0.18% return.iii The lower-quality outperformance was driven by the high-income return provided by this segment, and strong demand for municipal high-yield funds, which led to tighter quality spreads.iv
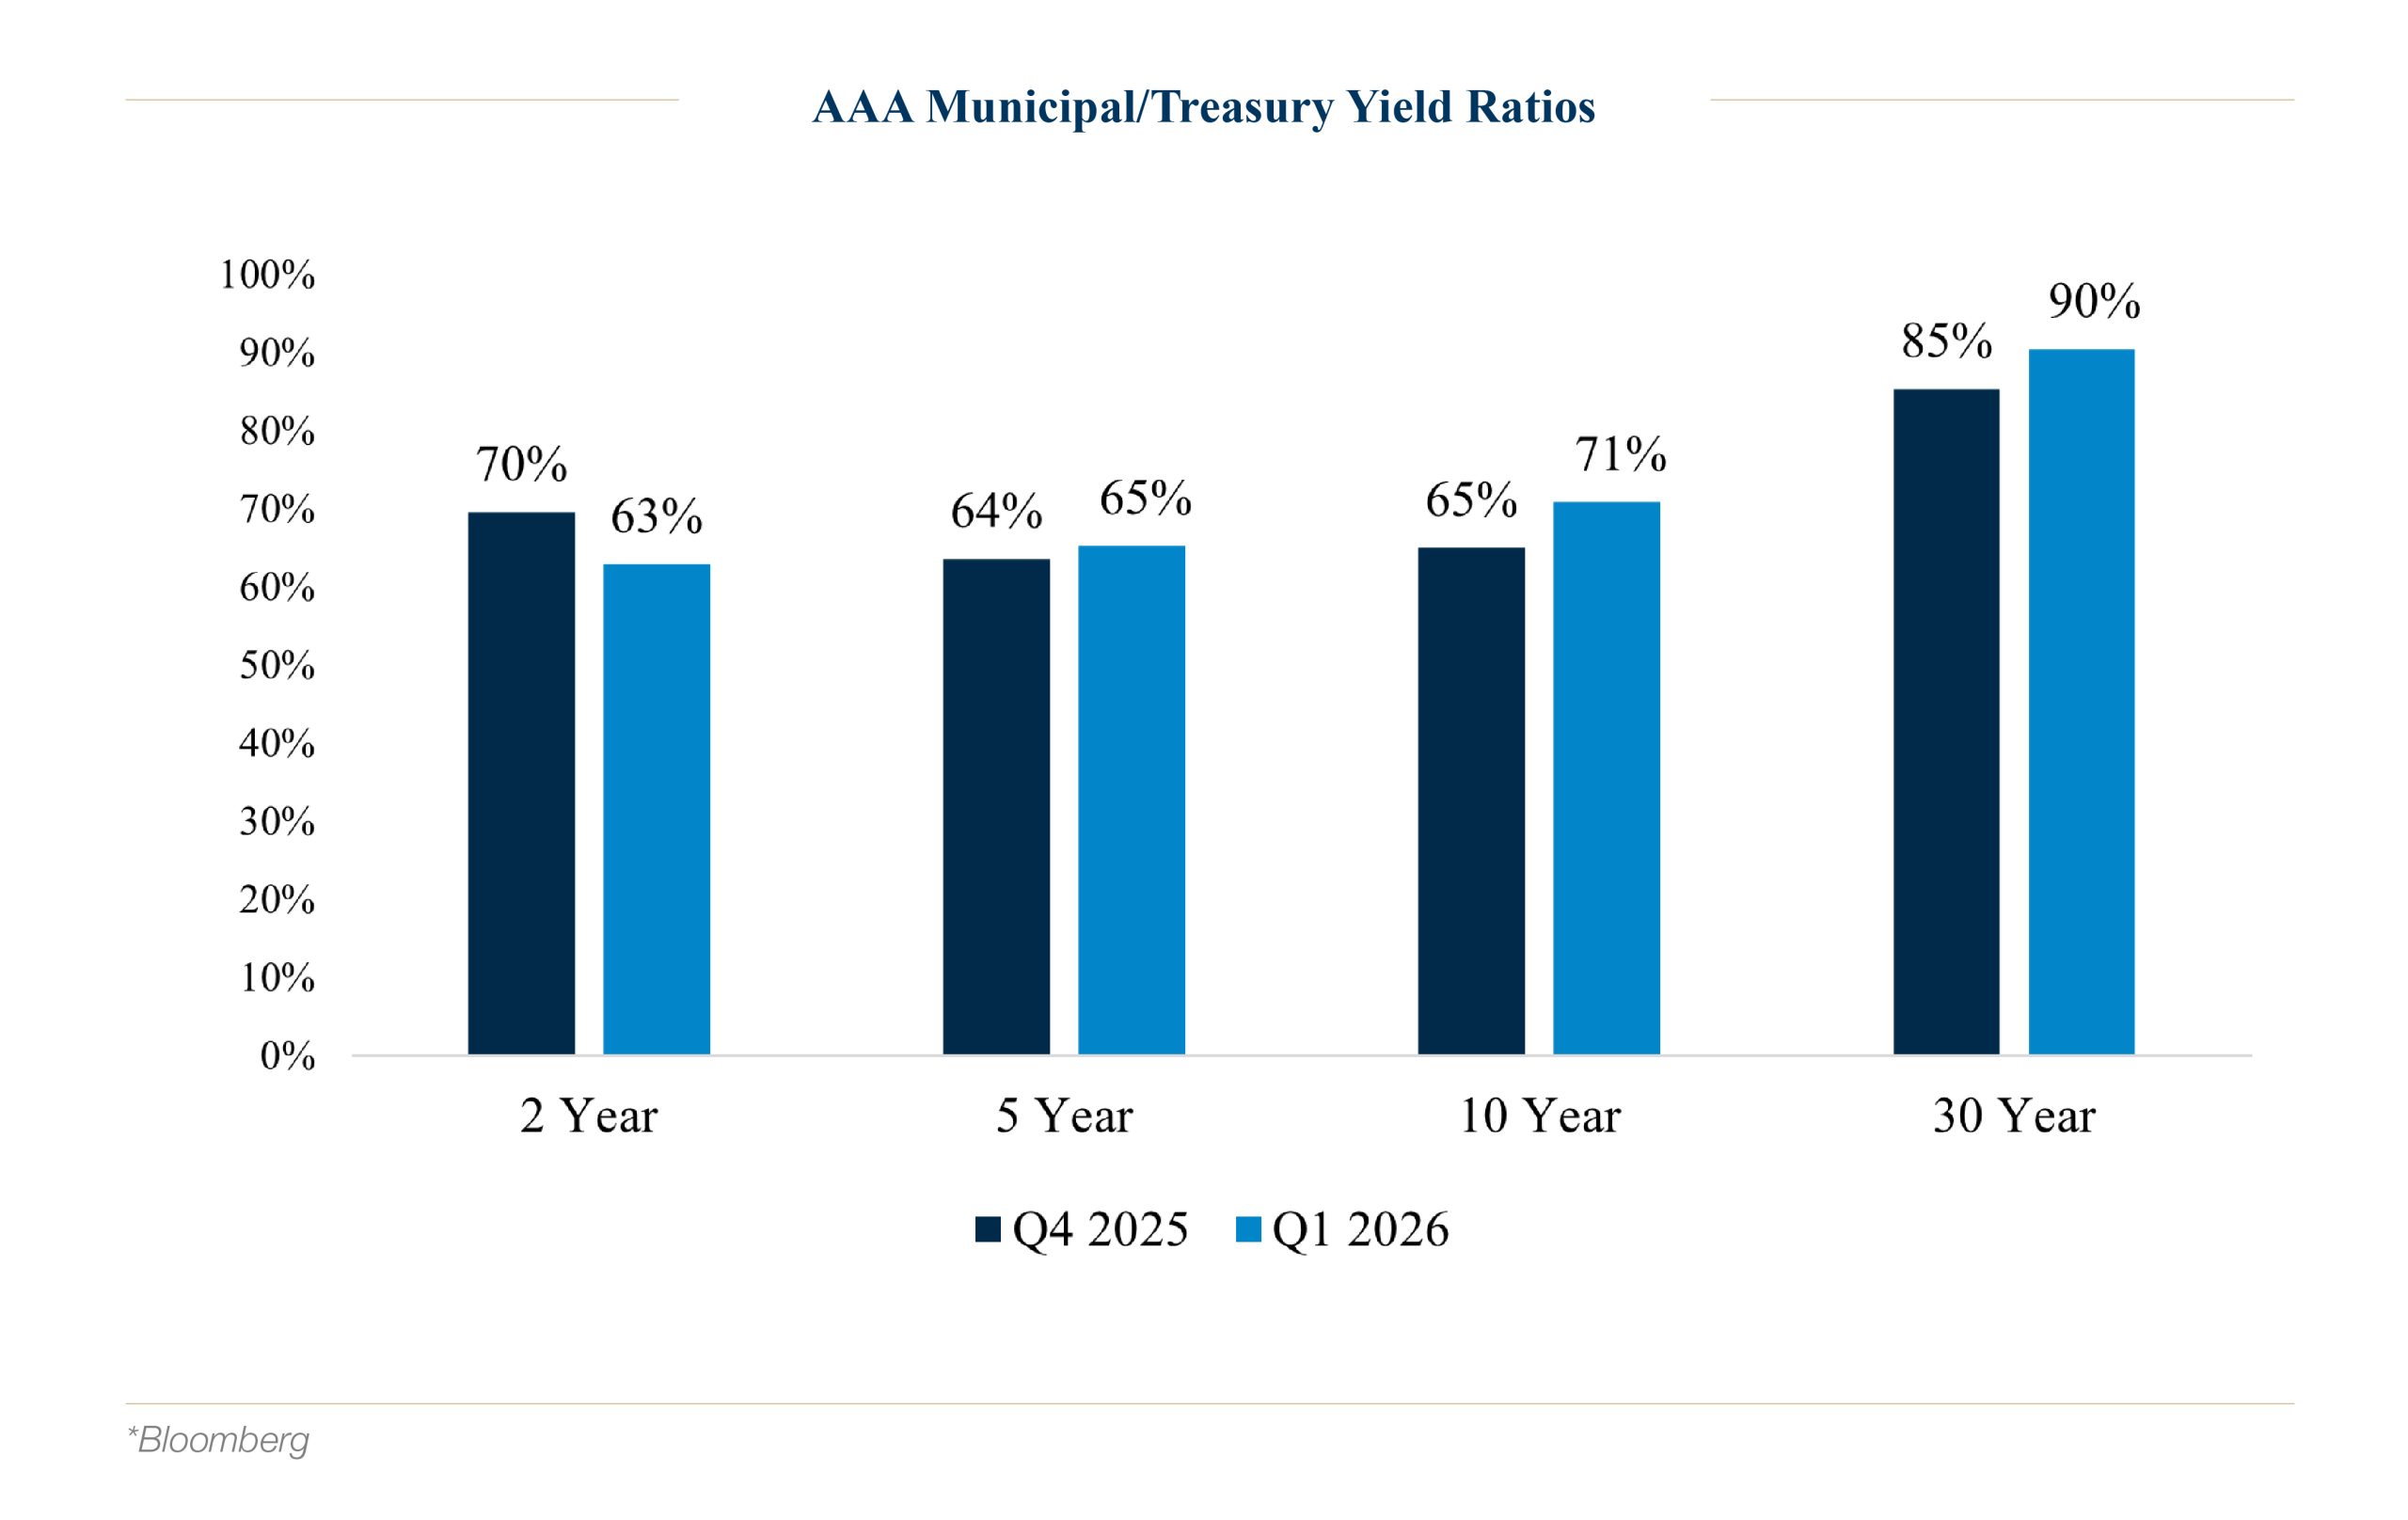
Compared with Treasuries, municipals notably outperformed in 2-year maturities, with the 2-year AAA Municipal/Treasury yield ratio declining by 7 percentage points. Municipals underperformed Treasuries in maturities of 10 years and longer.
Economic Landscape
Labor market readings remained mixed over the quarter. The latest employment report released in March continued to show weak non-farm payroll growth with a monthly average of just 6,000 job additions for the last 3 months. This follows a yearly report released in February showing strong downward revisions to non-farm payroll growth for the previous 12 months of -862,000.
More promising on the labor front, the unemployment rate remained remarkably steady during the quarter and well below recessionary levels, ranging from 4.3% to 4.4%. Some economists have pointed to the “low fire, low hire” environment, creating this slow payroll growth, coupled with a steady unemployment rate.
On the inflation side, core PCE, the Federal Reserve’s preferred measure of inflation, remained elevated. The latest report from March (which showed January data) indicated that core prices rose 3.1% year-over-year, the highest figure since March 2024. Goods inflation, which historically has detracted from topline inflation figures, contributed almost 0.5% to the 3.1% reading as tariff effects likely continued to filter through the economy.
It is worth noting that the economic data from the quarter reflects time periods before the Iran conflict began. Any geopolitical effects on economic growth, employment, and inflation will be reflected in future data releases and watched closely by the markets.
The Federal Reserve – After Cutting Rates Last Quarter, On Hold for Now
With unemployment showing no signs of rising and core PCE inflation running a full percentage point above target, the Fed declined to cut rates further in 1Q26 and kept policy rates unchanged. The Fed Funds target range remained 3.50-3.75%.
The March Fed meeting gave market participants their first insight into the Federal Reserve’s views regarding the economic fallout from the conflict. Investors closely assessed Chair Powell’s comments regarding the inflationary and growth potential impacts from the conflict, and any implications to monetary policy. Chair Powell stated that “looking through”, or tolerating, inflation from the oil supply shock would have to be undertaken cautiously. Powell referred to the inflation expectations of consumers as a key component when making this assessment, whether to look through any geopolitically driven price pressures.
Additionally, at the March meeting, Powell offered a statement saying he intended to stay on as Fed Chair until his successor, Kevin Warsh, is confirmed, even if the confirmation occurs after Powell’s term is up in May.
Ultimately, the market interpreted the meeting’s overall tone as hawkish, and Treasury yields rose that day.
The market’s outlook for Fed policy became interesting after the March meeting. As oil prices continued to rise in March, the Fed Funds futures market briefly priced in a probability of a hike by as much as 50% by this year’s September meeting. However, the expectations for a hike were short-lived and dissipated by quarter-end.
Municipal Market Deeper Dive: A Strong Start to the Quarter, but Geopolitical Risk Dragged on March Performance
Municipal bonds began the year on a strong note, with solid monthly performance of 0.94% and 1.25% in January and February, respectively, as measured by the Bloomberg Municipal Bond Index.v The primary driver: strong inflows to municipal bond funds, which spurred substantial new demand in the market. Net inflows totaled $18B through February,vi the third-highest pace on record, as attractive yields, strong returns in recent months, and yearly asset reallocation may have encouraged buyers.
New issue supply remained at a record pace in January and February, increasing in total by 4% from last year.vii While record-high supply could have been problematic for market returns, new investor demand helped absorb the supply without issue. Some new issue deals in January saw up to 18-20 times oversubscription levels, indicating the great demand in the marketplace.
However, as March rolled around, it became a tale of two different markets. Rapidly rising U.S. Treasury yields in response to the Iran conflict pushed municipal yields higher, resulting in a -2.32% return for the month.viii
Exacerbating the sell-off in March was the fact that municipals started the month at rich relative valuations versus Treasuries. Also, retail sentiment appeared affected by the sharply rising rates and overall volatility in the markets, as weekly inflows to municipal funds moderated in March, and even turned negative for one week.ix
The return in March was a rate-driven story as global bond yields rose due to inflation worries, as opposed to concerns specific to the municipal bond market.
Notable Municipal Market Action in 1Q26
The municipal yield curve remained an interesting topic during the quarter. The curve continued to steepen in the first part of the period, as investor demand for short and intermediate-term bonds remained robust. The 10- to 20-year segment of the municipal curve reached a peak of 135 basis points in the quarter.x
As shown in the chart below, 135 basis points is the steepest level of the 10- to 20-year municipal curve over the last 15 years. Only during rare events, such as the 2008 Financial Crisis and the 2010 60 Minutes interviewxi, when an analyst incorrectly predicted widespread municipal defaults, did the slope reach these levels.
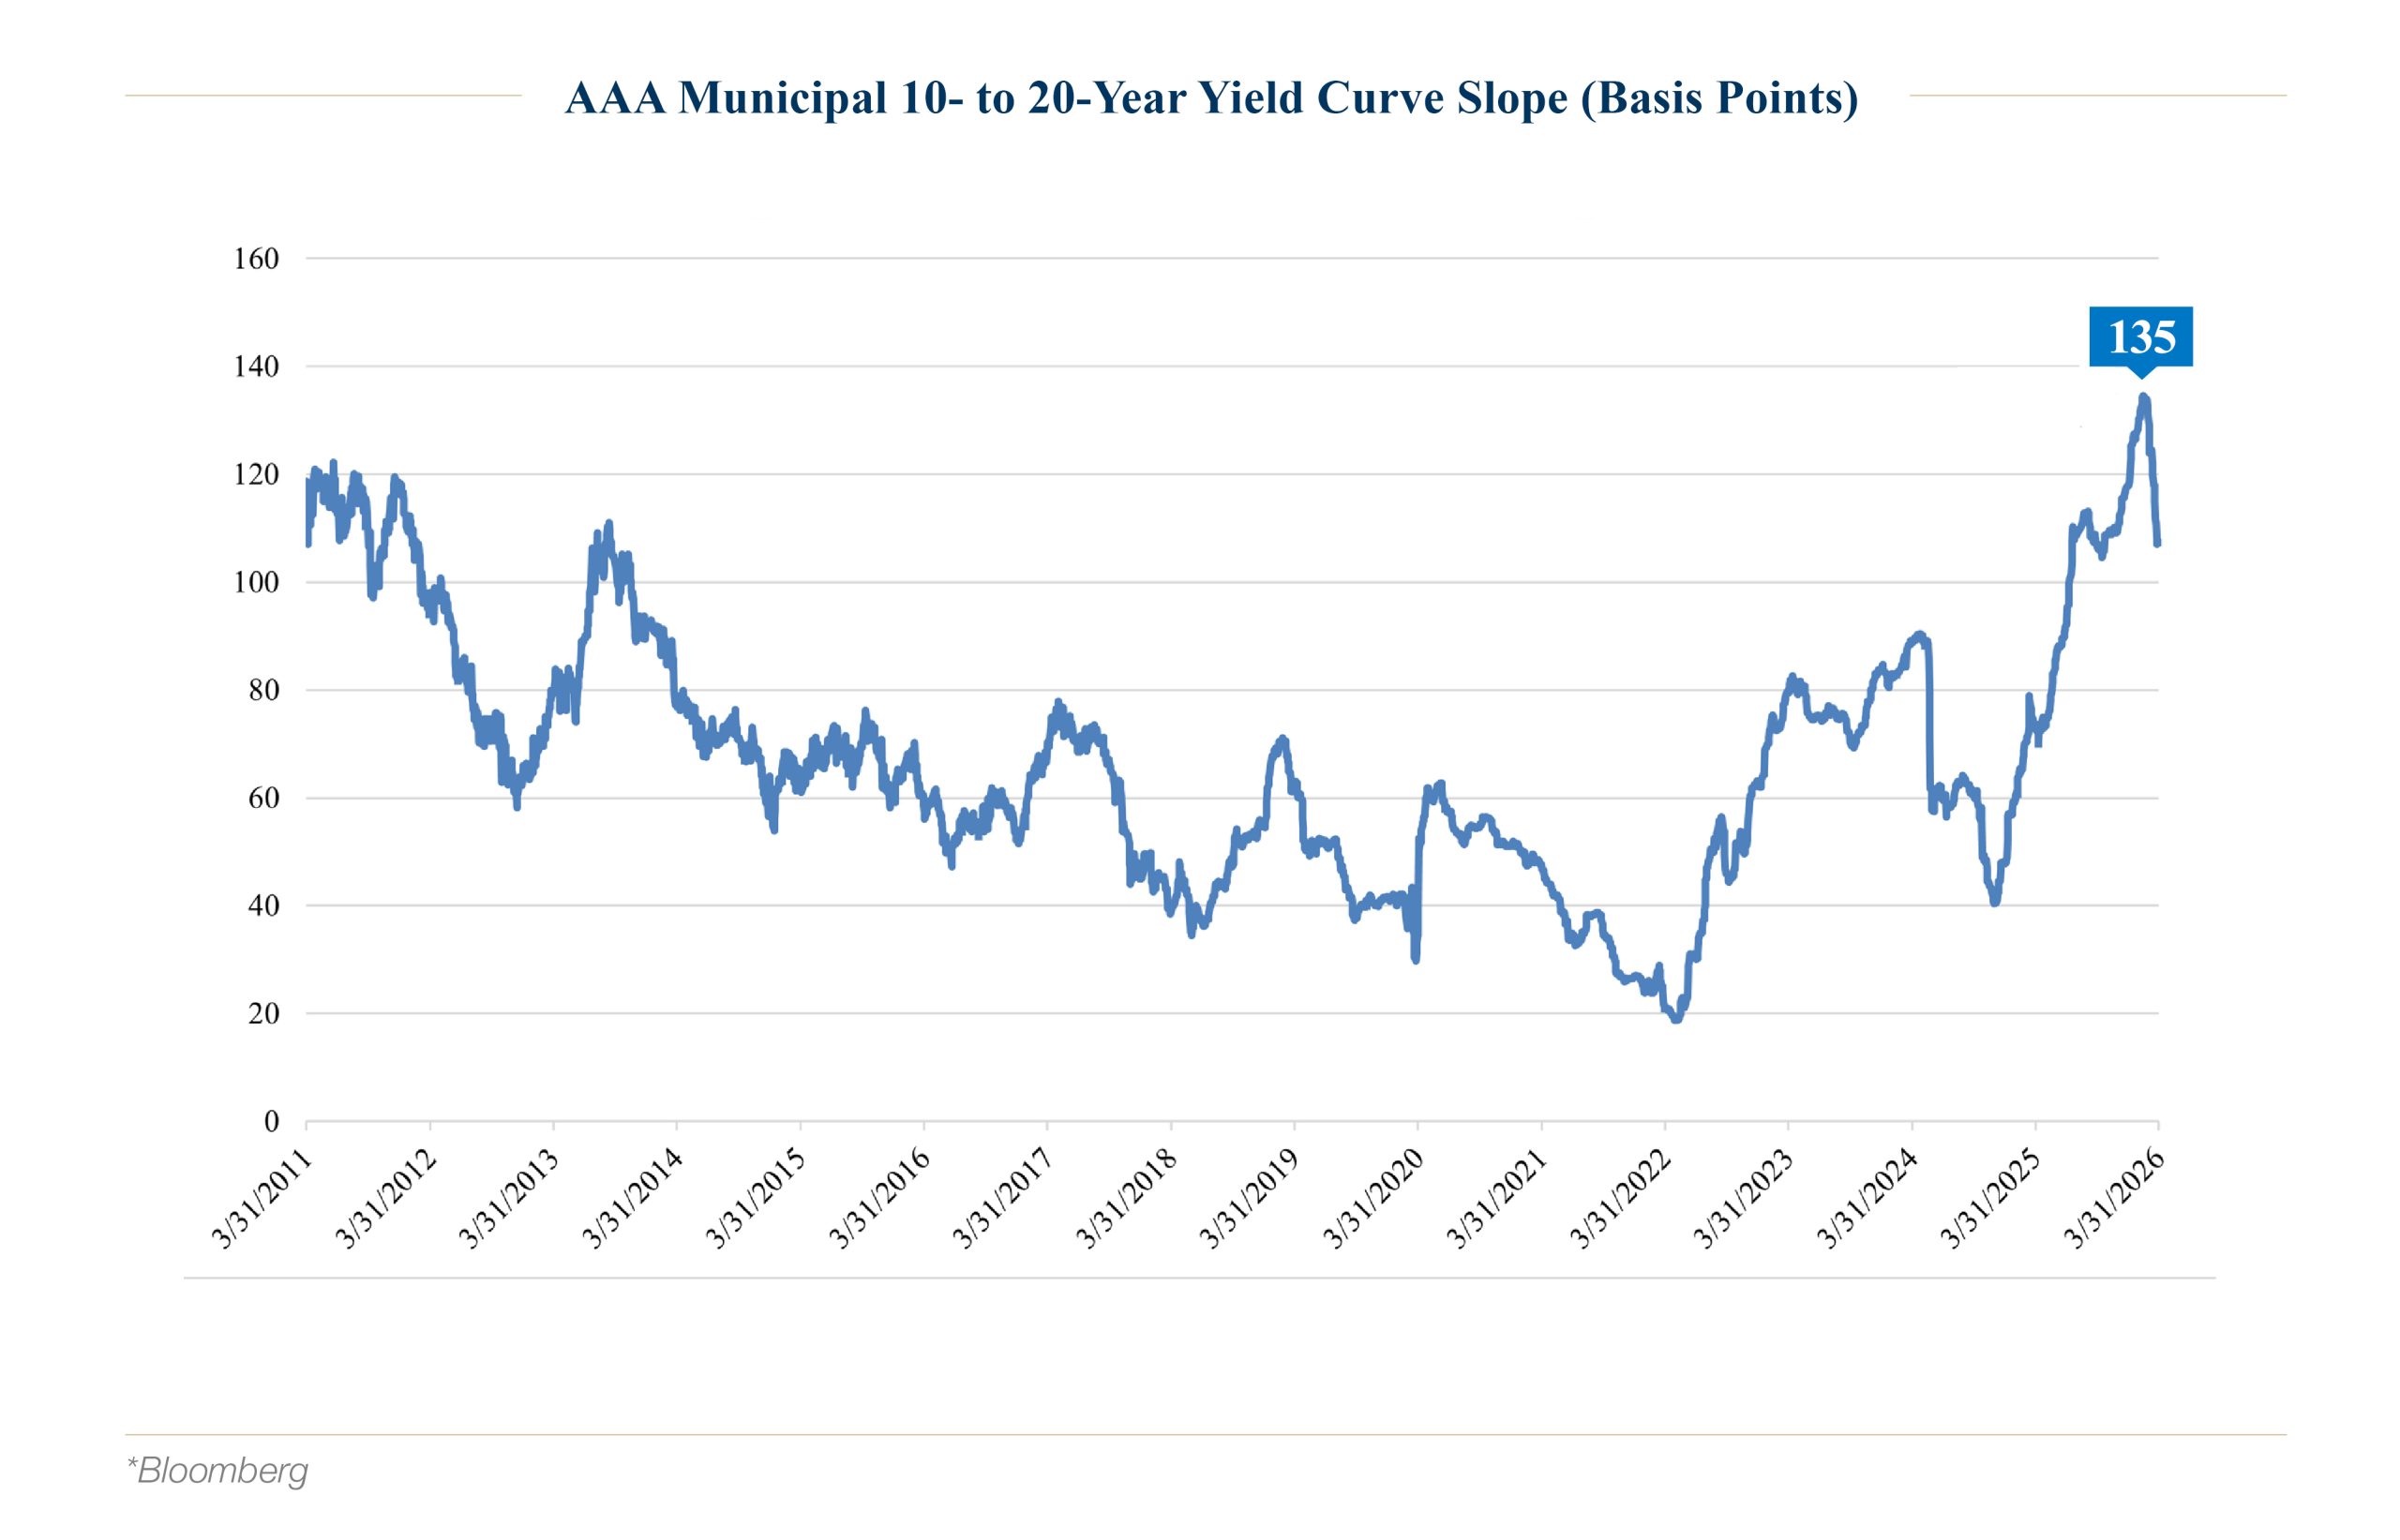
Toward the end of the quarter, municipal bond investors began to capitalize on the historically higher yields available in longer bonds compared to 10-year maturities, and the curve flattened from its peak.
1st Quarter Credit Review
Summary
As 1Q26 came to a close, the municipal credit narrative was driven by a concentrated set of policy and rating agency actions. The most notable themes were state-level tax proposals that could alter revenue structures and taxpayer behavior; notably Washington’s newly enacted millionaire tax and California’s proposed billionaire tax, alongside several credit-specific developments: Moody’s proposed methodology change for nonprofit healthcare and tax-backed healthcare districts, S&P’s still-evolving assessment of wildfire risk for California public utilities, Chicago’s downgrades amid persistent structural imbalance and reliance on nonrecurring measures, and New York City’s negative outlook revisions tied to widening multiyear budget gaps. Taken together, 1Q26 reinforced our focus on governance, financial resilience, and exposure to policy and event-driven credit-related risks within the municipal market.
Tax Proposals and Ballot Initiatives
State of Washington’s Proposed Millionaire Tax
At the end of March, Governor Bob Ferguson of Washington signed into law Senate Bill 6346, which establishes a new 9.9% state tax on personal income above $1M. The tax is scheduled to take effect on January 1, 2028.xii The new law would change the state’s revenue structure, which currently relies mostly on sales tax.
State of California’s 2026 Billionaire Tax Actxiii
The proposed 2026 Billionaire Tax Act in California is a ballot initiative that imposes a one-time 5% tax on the net worth of state residents with a net worth of $1B or more.
The initiative would require Californians with a net worth of more than $1.1B to pay a one-time tax equal to 5% of their assets, while those with a net worth between $1B and $1.1B would pay a smaller percentage. It would apply retroactively to anyone living in California as of Jan. 1, 2026, and taxpayers could spread their payments over five years starting in 2027. The State would be required to spend 90% of the new revenues on healthcare, with the rest devoted to food assistance and education.
The wealth tax proposal is sponsored by the healthcare union Service Employees International Union-United Healthcare Workers West and is intended to offset federal budget cuts to social services. It requires 875,000 signatures to get on the state ballot in November and must then win approval.
Rating Agency Actions
Moody’s NFP Healthcare Proposed Methodology Changexiv
Under the proposed changes, Moody’s would expand the scope of instruments that it rates using this methodology to include certain debt instruments supported by a general obligation unlimited tax (GOULT) or general obligation limited tax (GOLT) pledge, both of which Moody’s currently rates using its U.S. Public Finance General Obligation Debt methodology.
Scope: Narrows the reach of several existing U.S. public finance methodologies. Moody’s proposes to limit the range of the following U.S. public finance methodologies by removing the assessment of U.S. healthcare entities from their in-view universe:
- U.S. Public Finance General Obligation Debt
- Lease, Appropriation, Moral Obligation, and Comparable Debt
- U.S. Public Finance Special Tax Debt
If this methodology is updated as proposed, Moody’s expects that up to 12% of healthcare entities would have at least one of their outstanding ratings change. The majority of the rating changes would be to tax-backed healthcare districts that Moody’s currently rates using its U.S. Public Finance General Obligation Debt methodology. The rating changes would mainly be downgrades, most by one to two notches, although some would have more substantial rating movement. The remaining rating changes would be upgrades, mostly by one notch, with a few changing by more than one notch.
California Wildfire Risk – Still Evolving
In January, S&P published a report that effectively states that they are still in the process (a year later) of assessing wildfire risks in relation to municipal utilities in California. According to S&P, following the Los Angeles area wildfires in early 2025, they reviewed their portfolio of 47 not-for-profit (NFP) utilities in California to reflect their evolving views on risks and mitigating factors they incorporate into their analysis. This review enhanced existing surveillance practices.xv

Multiple Rating Agency Downgrades – City of Chicagoxvii
In February, Fitch and Kroll downgraded the City’s General Obligation (G.O.) debt ratings to BBB+ from A-; the outlook remained Negative from both agencies.
As described by both Fitch and Kroll and summarized in the City Council Office of Financial Analysis’ report, the downgrades reflected consecutive operating deficits since 2023, the still-high dependence on non-structural solutions and assumptions underpinning the adopted 2026 budget, persistent out-year gaps, and ongoing disagreements between the Mayor and the City Council.
Spending levels continued to rise, contributing to a structural imbalance that reached $1.2B for 2026 (about 20% of the general fund budget), up from $982M in 2025 and $538M in 2024. Both rating agencies (Fitch in particular) do not expect significant budget reductions, specifically involving broad program or service cuts. The City is pursuing new revenue streams that require State or voter approval. Property tax increases, which the City can implement under home rule, do not appear to have political support.
The 2026 budget provides several structural solutions, most notably an increase in the personal property lease tax rate that the City projects will raise $416M in new and recurring revenue. The budget also relies on measures that are less fiscally prudent/reliable. These include the securitization of uncollected debt owed to the City, the use of new bond proceeds to finance retroactive firefighter wage obligations, and reliance on new tax revenues that are subject to legal challenge. The budget also relies on improved revenue projections that may not materialize.
New York City’s Recent Rating Agency Actions
In March, Moody’s and Fitch revised NYC’s outlook to Negative from Stable. According to Moody’s, the outlook changes reflected NYC’s updated spending projections, which give rise to larger multiyear budget gaps than previously forecast. That the City projects large and persistent imbalances under still-favorable economic and revenue conditions highlights the extent of its underlying structural budget challenges.
According to Fitch, the outlook revision to Negative on New York City’s IDR, GO bonds, and appropriation-supported bonds reflects the potential for weakening of the City’s financial resilience, widening of out-year budget gaps, and uncertain gap-closing solutions that could require city or state approvals.
Over the next 12 months, the outlook will be influenced by the City’s ability to narrow projected gaps through recurring measures and demonstrate progress toward restoring structural balance within its financial plan. Gap-closing strategies that rely on nonrecurring measures, including the use of reserves, would limit financial flexibility, especially if economic growth slows sharply or an outright downturn materializes. State-level proposals to enhance revenue or other spending policy changes that benefit the City could have a stabilizing effect over time, if enacted.xviii
ii Bloomberg, as of 3/31/26
iii See Endnote i
iv Using ytw differentials between Bloomberg Municipal Bond Index and Bloomberg Municipal Bond High Yield Index
v See Endnote i
vi Lipper Data, as of 2/26/26
vii Bloomberg, as of 2/28/26
viii See Endnote i
ix Lipper, week ending 3/25/26
x See Endnote ii
xi https://www.cnbc.com/2013/06/23/meredith-whitney-i-have-doubts-all-the-time.html (August 2014 update)
xii Bloomberg_Bondbuyer article: Washington state governor signs millionaires tax into law (March 31, 2026)
xiii Expert Report On The California 2026 Billionaire Tax: Revenue, Economic and Constitutional Analysis (December 31, 2025)
xiv Moody’s Not-for-profit Healthcare: Proposed Methodology Update (January 28, 2026)
xv S&P California Public Power Utilities Dampen Wildfire Flames While Questions of Long-term Resiliency Smolder (January 21, 2026)
xvi Ibid.
xviii Moody’s Report – Moody’s Rating revises New York City’s outlook to negative, affirms Aa2 issuer rating (March 11, 2026)
Disclosure
A&M Private Wealth Partners, LLC (“AMPWP”) is an SEC-registered investment adviser. SEC registration does not imply a certain level of skill or training. For additional information on the services AMPWP provides, as well as our fees for such services, please review our Form ADV at adviserinfo.sec.gov, contact us at 300 Banyan Boulevard, 10th Floor, West Palm Beach, FL 33401, or call us at (561) 268-0900.
This piece and its content reflect AMPWP’s views at the time of its writing, and the information presented and AMPWP’s views are for informational purposes only. Such views are subject to change at any time without notice including due to changes in market or economic conditions, and forward-looking statements or forecasts are based on assumptions and may not be realized. Future events and outcomes are inherently uncertain. Statements are subject to risks and uncertainties that could cause actual outcomes to differ. AMPWP has obtained information provided herein from various third-party sources believed to be reliable, however, such information is not guaranteed and is subject to errors, omissions, and changes. No reliance should be placed on the views and information presented when making any investment or liquidation decision. AMPWP is not responsible for the consequences of any decisions or actions taken or not taken as a result of the views and information presented, and AMPWP does not warrant or guarantee the accuracy or completeness of this piece or information presented.
Additional content may be relevant for further context or other insight. Portfolios should also be viewed in the context of the broad market and general economic conditions prevailing during the periods covered by performance and other information. Any references to future returns and/or risk are not promises of the actual return a portfolio may achieve nor do they reflect all risks. Not all investments are suitable for all investors. All investments involve risk of loss, including to principal, and all investors must be prepared to bear such loss. Different securities, strategies, and allocations have different costs and risks, and diversification also does not assure a profit nor protect against a loss. Past performance is not a guarantee of future results. Additionally, changes in investment strategies, contributions, or withdrawals may materially alter results, as may market conditions, other factors including but limited to economic factors, fees, expenses, and events. Nothing herein should be construed as an investment recommendation. AMPWP does not provide legal, accounting, or tax advice, and AMPWP’s services are not intended to act as a substitute for such advice. AMPWP encourages you to seek the counsel of a qualified attorney and/or accountant for legal, accounting, or tax advice.